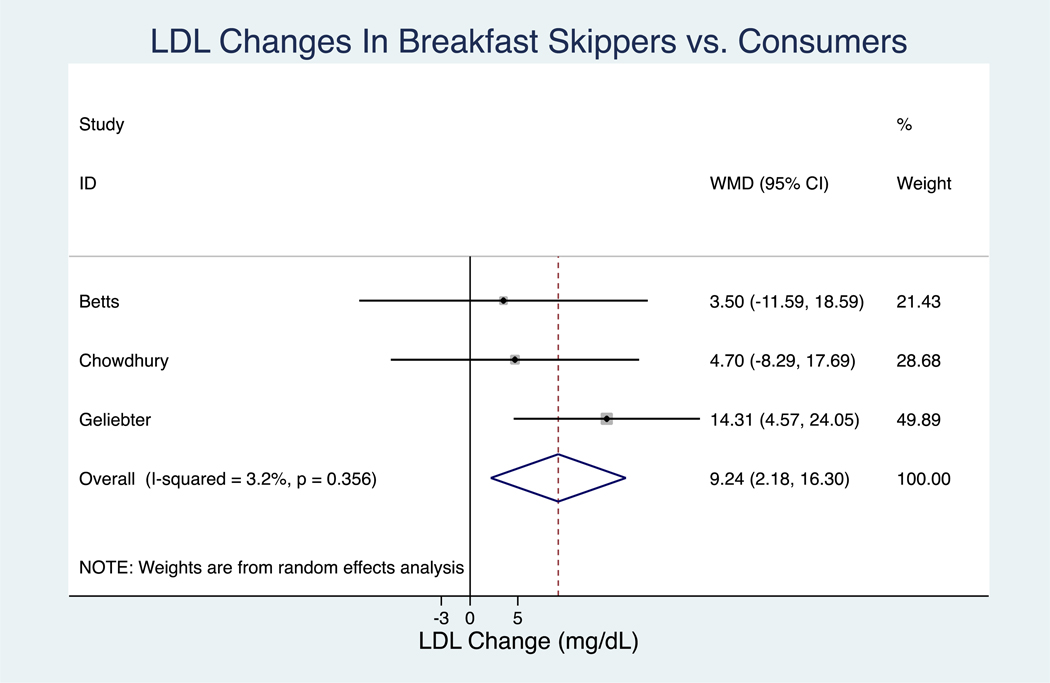
Figure 2.
Random-effects model meta-analysis for changes in (A) HDL and (B) LDL concentrations in milligrams per deciliter from RCTs comparing breakfast skipping versus breakfast consumption. Conversion factor: TC from millimoles per liter to milligrams per deciliter: 38.67. Closed rectangles and horizontal bars represent the overall estimates (difference of means) and 95% CIs for individual studies. Diamonds represent the overall estimate combining all the studies. HDL, high-density lipoprotein cholesterol; ID, identifier; LDL, low-density lipoprotein cholesterol; RCT, randomized controlled trial; TC, total cholesterol; WMD, weighted mean difference.

