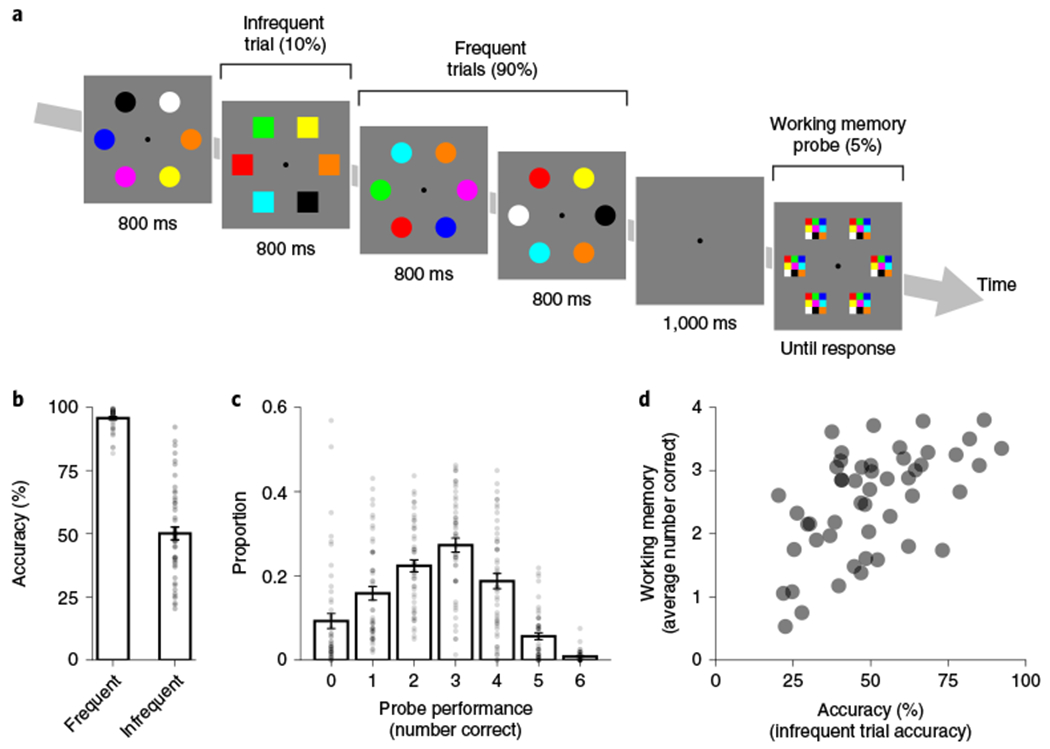
Fig. 1 |. Sustained attention relates to working memory performance in an interleaved task.

a, Design of the sustained attention and working memory task. On each trial, an array of six items (either circles or squares) of different colours was presented. For the sustained attention task, participants (n = 50) responded to the shape. To encourage habitual responding, one of the shapes was much more frequent (90% circles versus 10% squares). For the working memory task, participants clicked the colour of each item after a 1 s delay. In experiment 1a, memory was probed for the infrequent category trials, whereas in experiment 1b, memory was probed for the frequent category trials (as depicted). Participants did not know when working memory probes would appear (5% of total trials). b, Sustained attention performance. Accuracy was higher for frequent (96% accuracy) versus infrequent (50% accuracy) trials (Δ = 46%; n = 50; one-tailed P < 0.001; d = 2.69; 95% CI = 41–50%). The height of each bar depicts the population average. Error bars represent the s.e.m. Each dot depicts the data from each individual in experiments 1a,b. c, Working memory performance. In the whole-report working memory task, performance on each trial ranged from 0 (no items correct) to 6 (all items correct). The average number of items correct was above chance (m = 2.51; n = 50; one-tailed P < 0.001; d = 2.22; 95% CI =2.27–2.72). The height of each bar depicts the population average. Error bars represent the s.e.m. for each response. Each dot depicts the proportion of that response for each participant in experiments 1a,b. d, Relationship between sustained attention and working memory across participants. Sustained attention accuracy in relation to the infrequent trials was positively correlated with average working memory performance across all participants (Spearman’s r = 0.56; n = 50; P < 0.001). Each dot depicts the data from one participant in experiment 1a,b.
