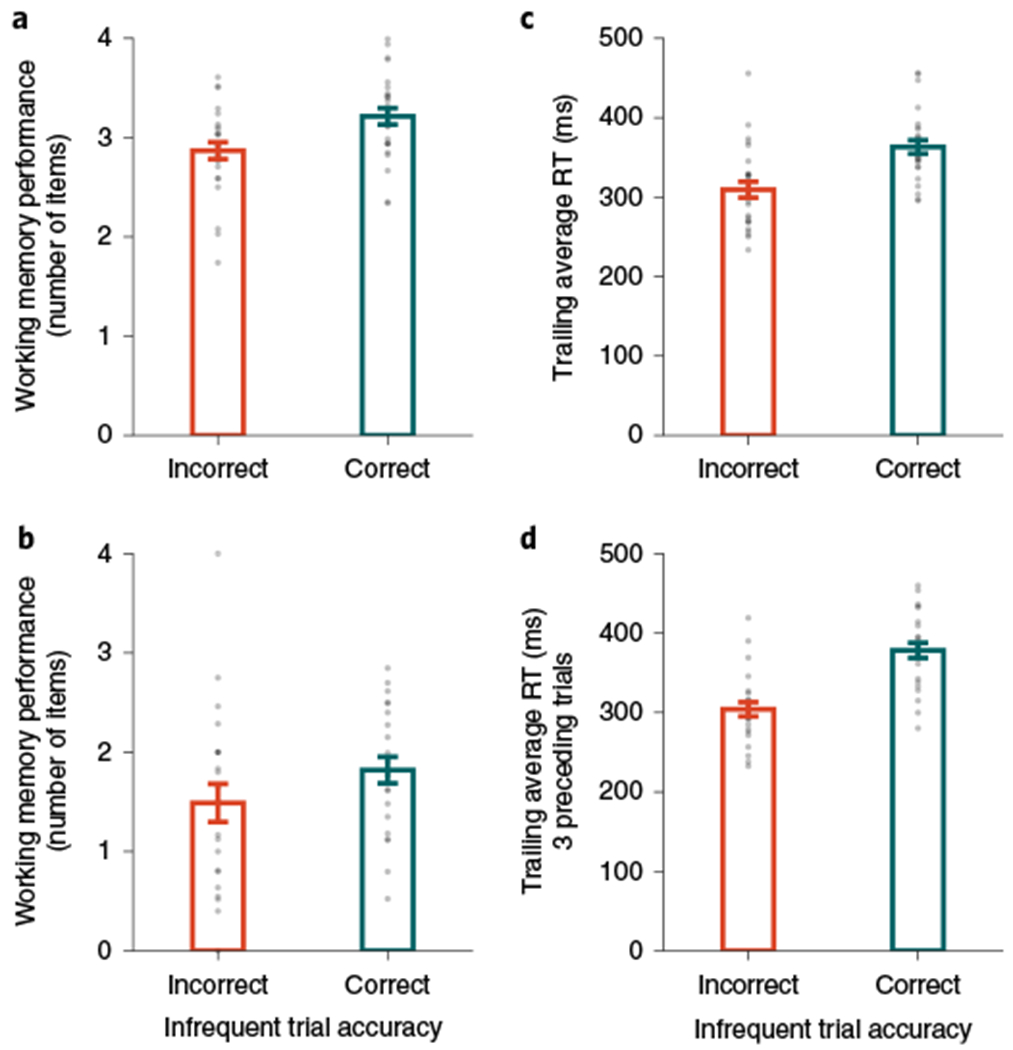
Fig. 2 |. Fluctuations of attention predict working memory performance within participants.

a, Experiment 1a: attention lapses influence working memory performance. Participants remembered fewer items after an incorrect (orange) versus correct response (teal) in the sustained attention task (merr = 2.87; mcorr = 3.21; Δm = 0.35; n = 26; one-tailed P < 0.001; d = 1.11; 95% CI = 0.24–0.47). b, Experiment 1b: attention lapses influence working memory performance. Participants remembered fewer items after an incorrect (orange) versus correct response (teal) in the sustained attention task (merr = 1.49; mcorr = 1.82; Δm = 0.33; n = 22; one-tailed P = 0.006; d = 0.52; 95% CI = 0.09–0.61). c, Experiment 1a: attention RTs predict attention lapses. Participants made faster responses before an incorrect (orange) versus correct response (teal) in the sustained attention task ( ; ; ; n = 26; one-tailed P < 0.001; d = 1.68; 95% CI = 42–66 ms). d, Experiment 1b: attention RTs predict attention lapses. Participants made faster responses before an incorrect response (orange) versus a correct response (teal) in the sustained attention task (; ; ; n = 24; one-tailed P<0.001; d = 2.02; 95% CI =60–89 ms). In c and d, the trailing RT was calculated by averaging over the three preceding trials (i − 2, i − 1 and i) before each infrequent trial (i + 1). The height of each bar reflects the population average, and error bars represent the s.e.m. Data from each participant are represented as grey dots.
