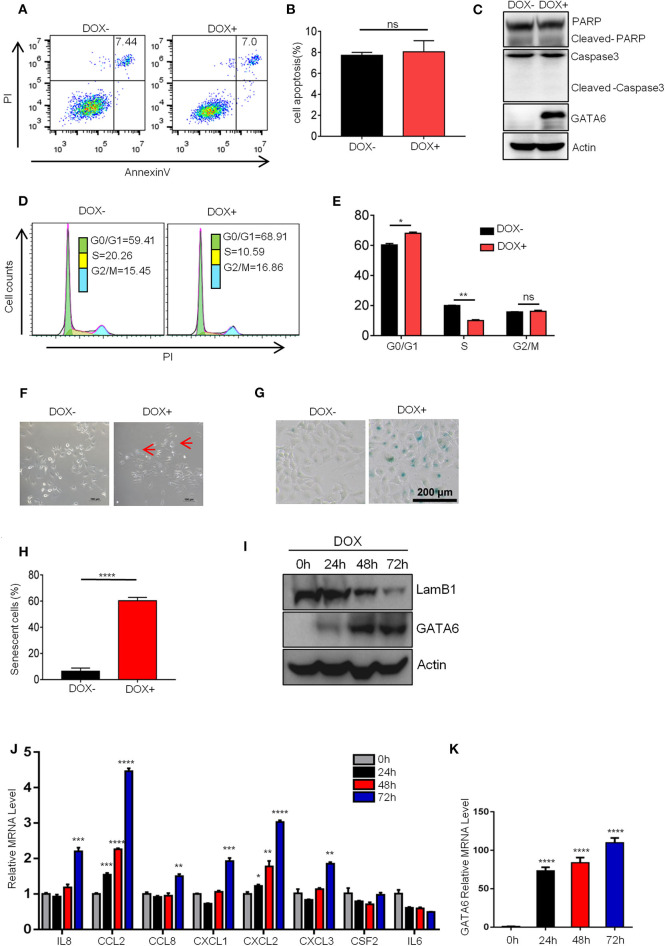
Figure 2.
GATA6 overexpression induces senescence of lung cancer cells. (A,B) FACS analysis of annexin-V and propidium iodide (PI)-stained apoptotic cells following DOX treatment. The A549i cells (1 × 10⁵) were treated with or without DOX (2 μg/ml) for 48 h before FACS analysis. (A) Representative image of Annexin-V-FITC/PI staining. (B) Quantitative data of Annexin-V-FITC/PI staining. (C) Western blot analysis of caspase 3 and PARP cleavage in A549i cells treated with or without DOX. (D,E) FACS analysis of propidium iodide (PI)-stained cells. A549i cells were treated with or without DOX for 48 h and stained with propidium iodide. DNA content was analyzed by flow cytometry. Results are represented as percent of cell population in G0/G1, S, and G2/M phases of the cell cycle. (D) Representative image. (E) Statistics of (D). (F) Morphology of A549i cells expressing GATA6. A549 cells were treated with or without DOX for 48 h (scale bars, 100 μm). Red arrow-head highlighted the senescent cells. (G,H) Senescence-associated β-galactosidase staining. A549i cells were treated with or without DOX for 48 h. (G) Representative staining. (H) Statistics of the positive percentage of senescence cells. (I) Western blot analysis of nuclear LaminB1 expression in A549i cells treated with or without DOX. A549i (5 × 10⁴) cells were seeded in six-well plates and cells were treated with DOX (2 μg/ml). Cells were harvested at 24, 48, and 72 h after DOX treatment and subjected to Western blot analysis for LamB1 expression. (J) qRT-PCR analysis of mRNA level of SASP markers in GATA6 expressing A549i cells at indicated time points. (K) qRT-PCR validation of GATA6 expression in the A549i cells at indicated time points. Data are representative of three independent experiments and were analyzed by unpaired t-test. Error bars denote SEM. *P < 0.05; **P < 0.01; ***P < 0.001; and ****P < 0.0001.

