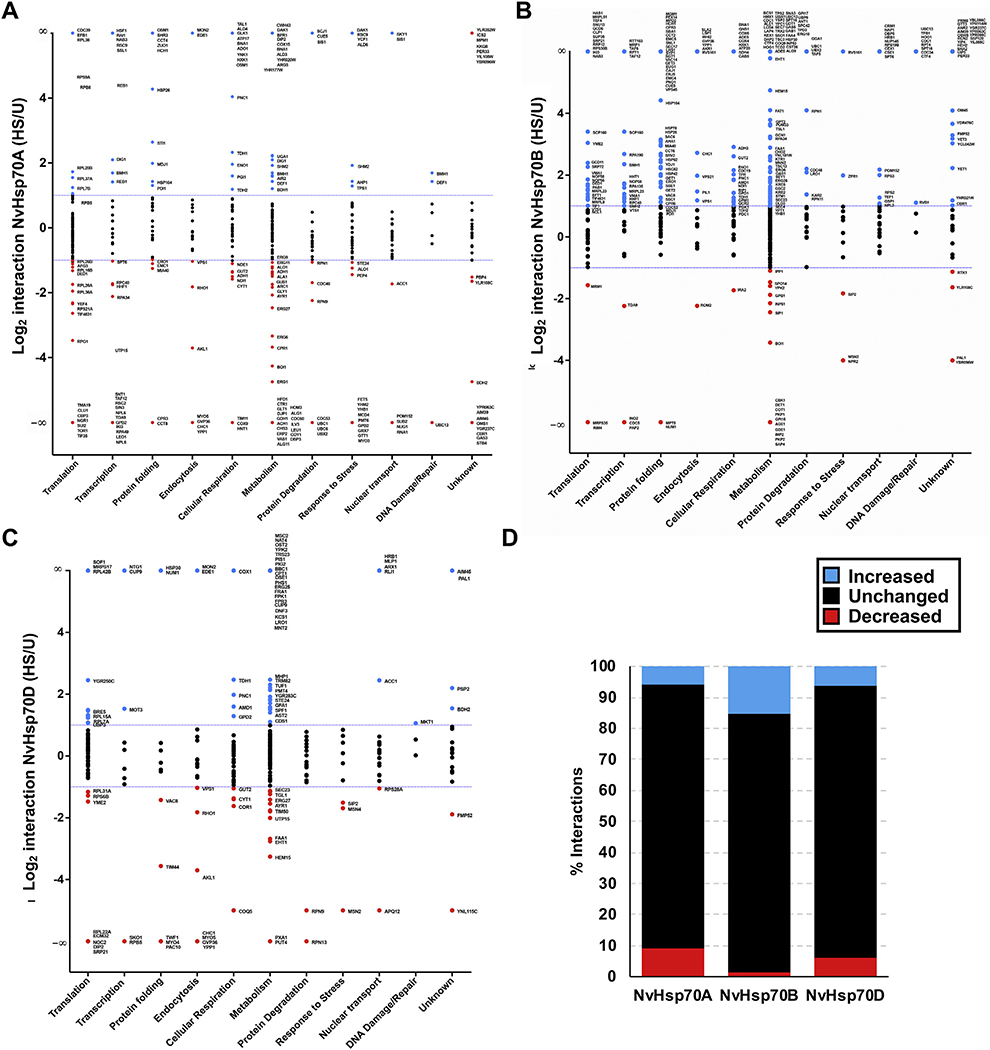
Fig. 3.
The dynamic NvHsp70A, B, and D interactomes during heat shock. Interactors were organized into functional categories following GO terms and plotted against interaction change (Log2 ratio) with either (A) NvHsp70A, (B) NvHsp70B, or (C) NvHsp70D following heat stress treatment (39 °C for 2 h). The dotted lines represent an interaction change of Log2 > 1 or Log2 < −1. Interactors are colored according to change in interaction as follows: blue (significant increase), red (significant decrease), or black (no significant change) upon heat stress. (D) Summary of each NvHsp70 interactome showing total number of increased, decreased and unchanged interactions upon heat stress. (For interpretation of the references to colour in this figure legend, the reader is referred to the web version of this article.)

