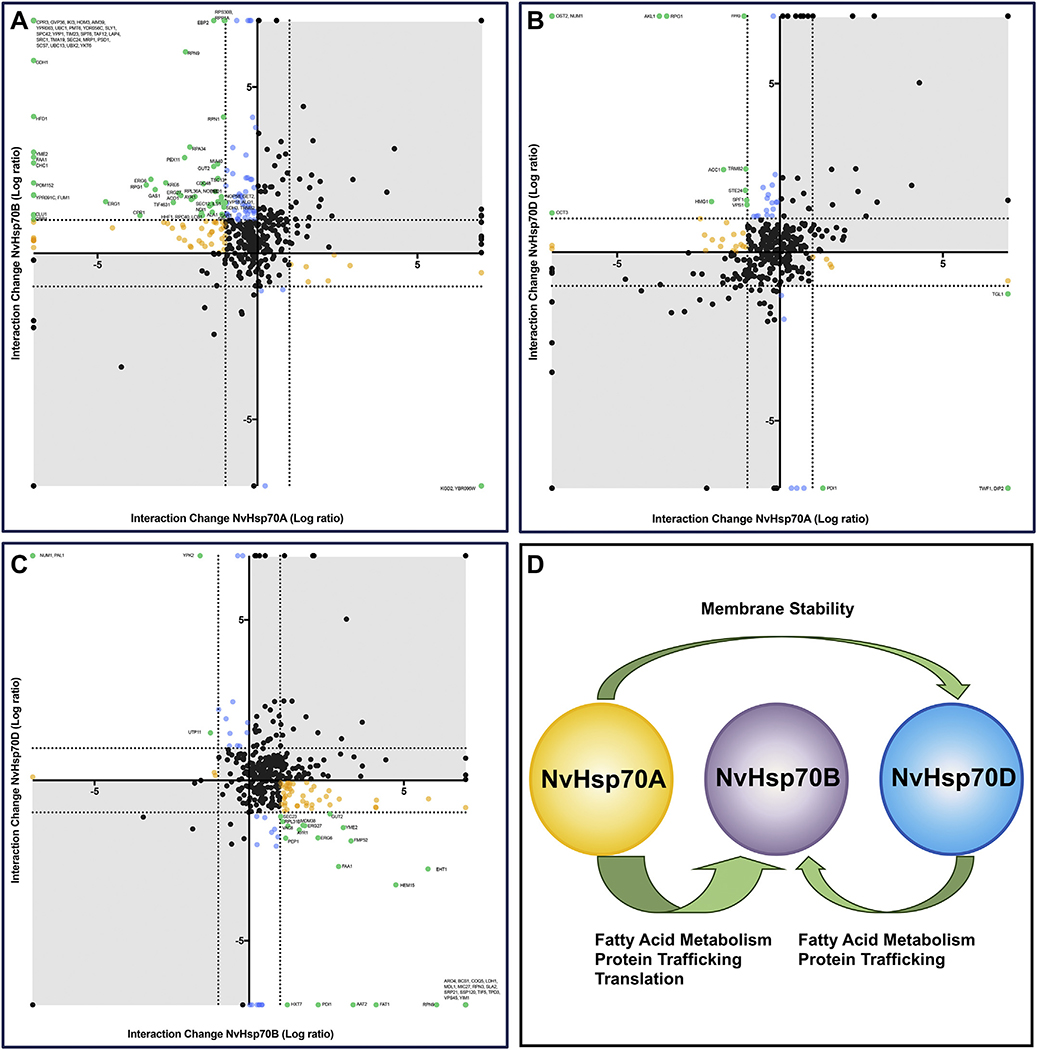
Fig. 5.
Understanding movement of clients between Hsp70 isoforms. (A) For each interactor observed to bind both NvHsp70A and NvHsp70B, change in association for NvHsp70A (Log2 ratio, X-axis) vs. change in association for NvHsp70B (Log2 ratio, Y-axis) was plotted. The dotted lines represent an interaction change of up or down two-fold. Interactors are colored according to significant change in chaperone association upon heat stress as follows: increased interaction with NvHsp70A, decreased for interaction with NvHsp70B (green); significantly altered interaction for NvHsp70B, but not NvHsp70A (blue); significantly altered interaction for NvHsp70A, but not NvHsp70B (yellow) and black (no significant change with either chaperone). (B) Interactions changes of NvHsp70A vs NvHsp70D upon heat stress. (C) Interactions changes of NvHsp70B vs NvHsp70D. (D). Summary of A-C. A large number of clients are transferred from NvHsp70A and NvHsp70D to NvHsp70B under heat stress. (For interpretation of the references to colour in this figure legend, the reader is referred to the web version of this article.)

