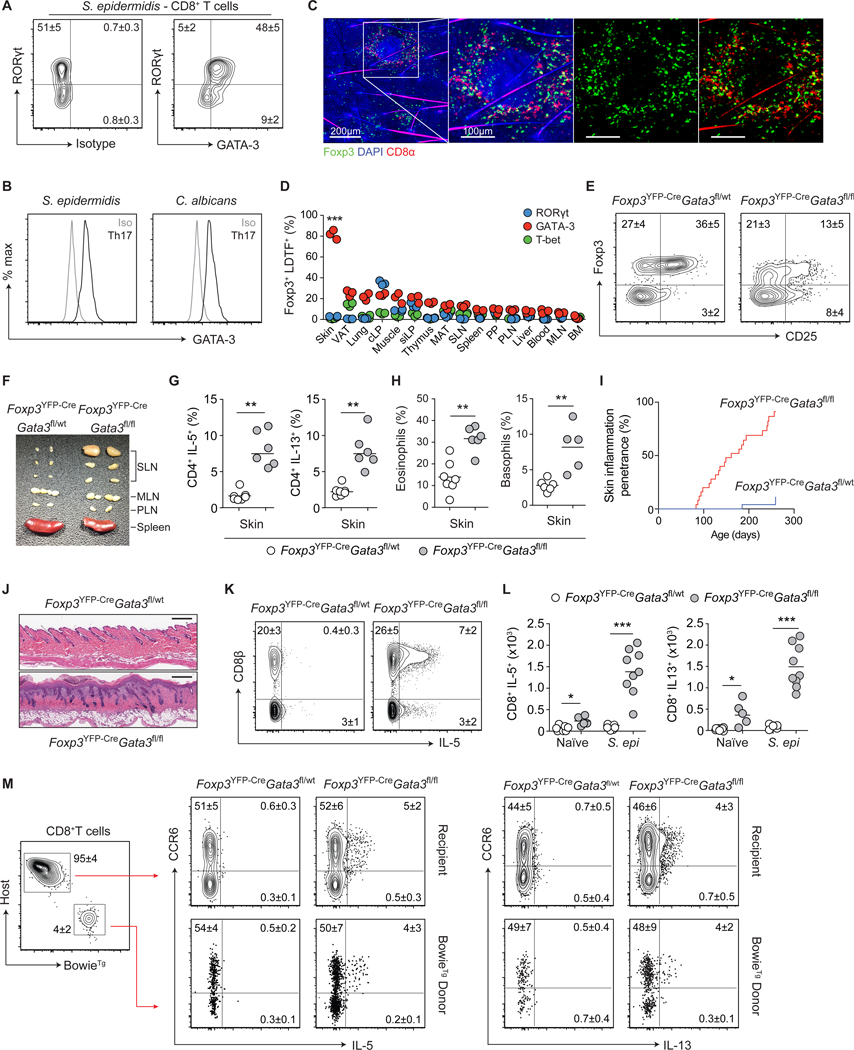
Figure 2: Local defects in immunoregulation unleash type-2 immunity from commensal-specific T cells.
(A) Representative contour plots of RORγt and GATA-3 expression by skin CD8+ T cells from S. epidermidis-colonized WT mice. (B) Representative histogram plots of GATA-3 expression by RORγt+ CD4+ Th17 cells from the skin of commensal-colonized WT mice. (C) Representative confocal imaging volume-projected along the z-axis of epidermal skin from S. epidermidis-colonized Foxp3gfp mice. (D) Frequencies of Foxp3+ Treg cells co-expressing lineage-defining transcription factors (LDTFs) within indicated tissues of naïve WT mice. Visceral adipose tissue (VAT), colonic lamina propria (cLP), small intestinal lamina propria (siLP), mesenteric adipose tissue (MAT), skin-draining lymph nodes (SLN), Peyer’s patch (PP), para-aortic lymph nodes (PLN), mesenteric lymph nodes (MLN), and bone marrow (BM). (E) Representative contour plots of Foxp3 and CD25 expression by skin CD4+ T cells from naïve Foxp3YFP-CreGata3fl/wt and Foxp3YFP-CreGata3fl/fl mice. (F) Representative cutaneous lymphadenopathy in Foxp3YFP-CreGata3fl/fl compared to Foxp3YFP-CreGata3fl/wt control mice. (G) Frequencies of IL-5- and IL-13-producing skin CD4+ T cells from naïve Foxp3YFP-CreGata3fl/wt and Foxp3YFP-CreGata3fl/fl mice. (H) Frequencies of skin eosinophils and basophils from naïve Foxp3YFP-CreGata3fl/wt and Foxp3YFP-CreGata3fl/fl mice. (I) Cumulative incidence of skin inflammation among naïve Foxp3YFP-CreGata3fl/wt and Foxp3YFP-CreGata3fl/fl mice. (J) Representative histological micrograph of skin tissue from naive Foxp3YFP-CreGata3fl/wt and Foxp3YFP-CreGata3fl/fl mice. Scale bar: 250 μm. (K) Representative contour plots of CD8β expression and IL-5 production potential by TCRβ+ T cells from the skin of S. epidermidis-colonized Foxp3YFP-CreGata3fl/wt and Foxp3YFP-CreGata3fl/fl mice. (L) Total numbers of IL-5 and IL-13-producing CD8+ T cells from the skin of S. epidermidis-colonized Foxp3YFP-CreGata3fl/wt and Foxp3YFP-CreGata3fl/fl mice. (M) Representative contour plots of IL-5 and IL-13 production by CD8+ T cells in Foxp3YFP-CreGata3fl/wt and Foxp3YFP-CreGata3fl/fl mice adoptively transferred with BowieTg T cells prior to colonization with S. epidermidis. Numbers in representative plots indicate mean ± SD. Each dot represents an individual mouse. Data represent at least two experiments with 3–7 mice per group. Cumulative skin inflammation data (I) represent 25 mice per genotype. *p < 0.05, **p < 0.01 as calculated using Student’s t-test (G, H) or one-way ANOVA with Holm–Šidák’s multiple comparison test (D, L).

