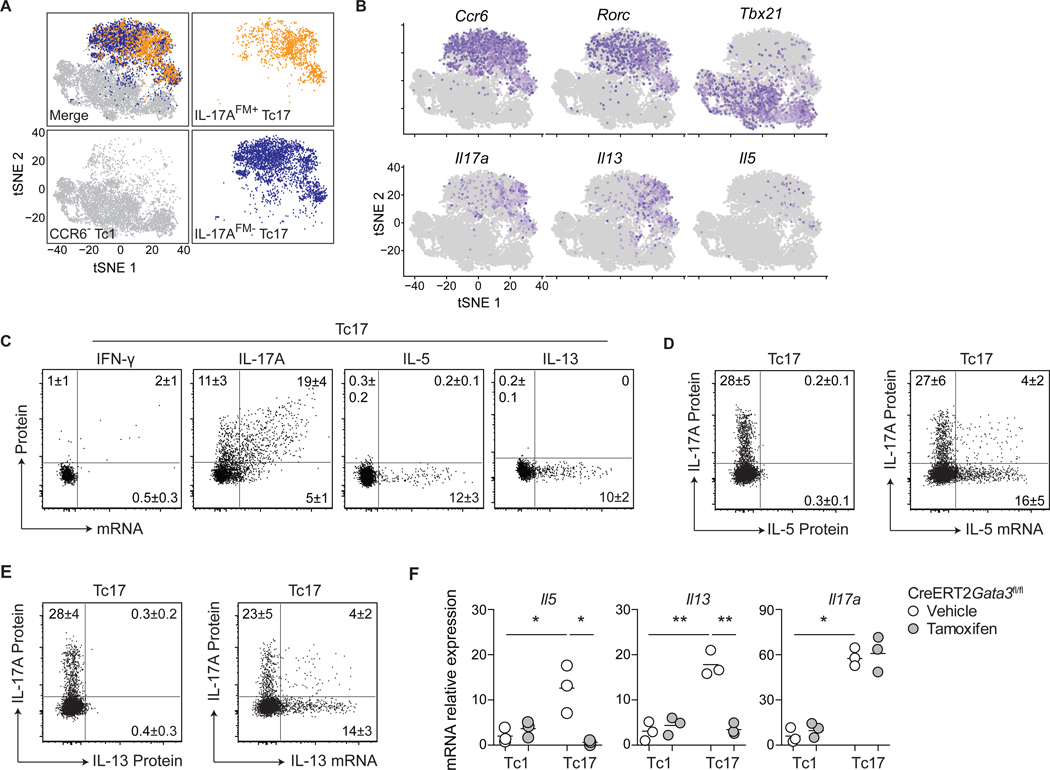
Figure 4: S. epidermidis-specific Tc17 cells harbor a poised type-2 transcriptome.
(A-B) Tc1 (CD8+CCR6−), IL-17AFM+ Tc17 (CD8+CCR6+eYFP+) and IL-17AFM− Tc17 (CD8+CCR6+eYFP−) cells were isolated by cell sorting from the skin of S. epidermidis-colonized Il17aCreR26ReYFP (IL-17AFM) mice and analyzed by scRNA-seq. (A) t-Distributed stochastic neighbor embedding (tSNE) plots of the scRNA-seq expression highlighting Tc1 (gray), IL-17AFM+ Tc17 (orange), and IL-17AFM− Tc17 (blue) populations. (B) Expression of LDTFs and cytokine genes projected onto a tSNE plot. (C) Representative dot plots of cytokine protein production potential and mRNA expression by Tc17 cells from the skin of S. epidermidis-colonized WT mice. (D-E) Representative dot plots of IL-17A and IL-5 or IL-13 production potential and Il5 or Il13 mRNA expression by Tc17 cells from the skin of S. epidermidis-colonized WT mice. (F) S. epidermidis-colonized CreERT2Gata3fl/fl mice received tamoxifen or vehicle control prior to cell sorting of skin Tc1 and Tc17 cells. Gene expression, in the indicated populations, was assessed by qRT-PCR. Numbers in representative plots indicate mean ± SD. Flow cytometric data represent at least two experiments with 4–6 mice per group. qRT-PCR data represent three biological replicates of eight pooled mice per group. *p < 0.05; **p < 0.01 as calculated using one-way ANOVA with Holm–Šidák’s multiple comparison test.

