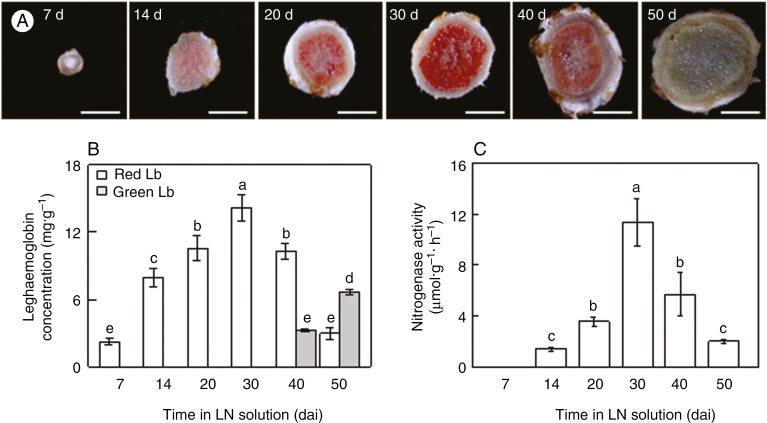
Fig. 1.
Leghaemoglobin concentration and nitrogenase activity in nodules at different growth stages. (A) Nodule colour at different growth stages. Scale bars = 2 mm. (B) Leghaemoglobin concentration. (C) Nitrogenase activity. Seven-day-old soybean seedlings were inoculated with rhizobia and grown in LN (530 μM N added) nutrient solution for 7, 14, 20, 30, 40 and 50 dai. Values are mean ± s.e. (n = 5). Different letters indicate a significant difference at the 0.05 level.

