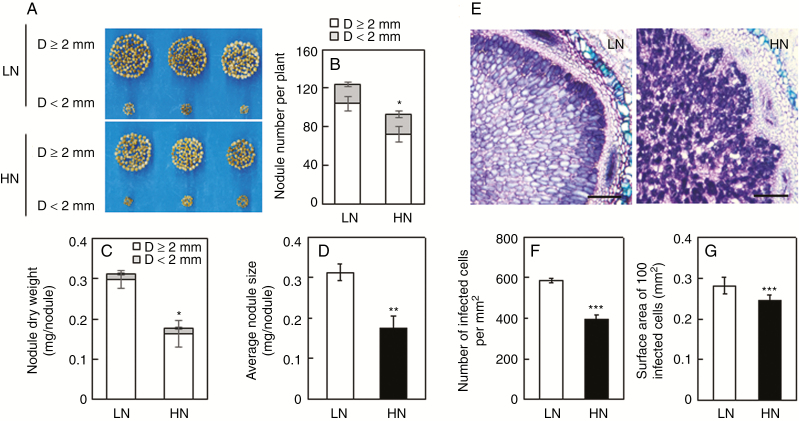
Fig. 3.
Effects of excess N supply on nodule growth and infected cell development. (A) Phenotypes of nodules. (B) Nodule number. (C) Nodule dry weight. (D) Average nodule size. (E) Toluidine blue-stained nodule cross-sections. Scale bars = 200 µm. (F) Number of infected cells. (G) Surface area of 100 infected cells. Seven-day-old soybean seedlings were inoculated with rhizobia and grown in LN (530 μm N added) nutrient solution for 30 d prior to transferring inoculated plants into LN or HN (20 mm N added) solution for 9 d. Nodules were classified into two groups according to diameter (D): large (D ≥ 2 mm) and small (D < 2 mm). Values are mean ± s.e. (n = 3). Ten nodules were selected from each replicate for infected cell analysis. Asterisks represent significant differences in a single trait between plants grown in LN and HN treatments: *0.01 < P ≤ 0.05; **0.001< P ≤0.01; ***P ≤ 0.001 (Student’s t-test).

