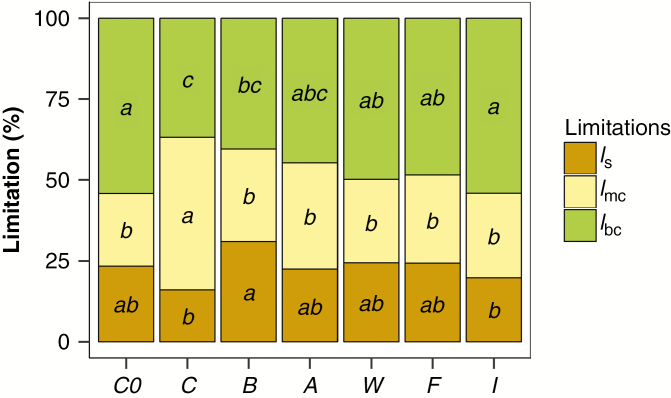
Fig. 5.
Quantitative limitation analysis of photosynthetic CO2 assimilation. Stomatal (ls), leaf mesophyll (lmc) and biochemical (lbc) limitations are represented. Values are means, and different letters show significant differences in each limitation parameter among treatments (P < 0.05, post-hoc Duncan’s test, n = 4). Treatments are C0 = initial group, C = control, B = beetles, A = ants, W = wasps, F = flies, I = root fertilized with inorganic solution.

