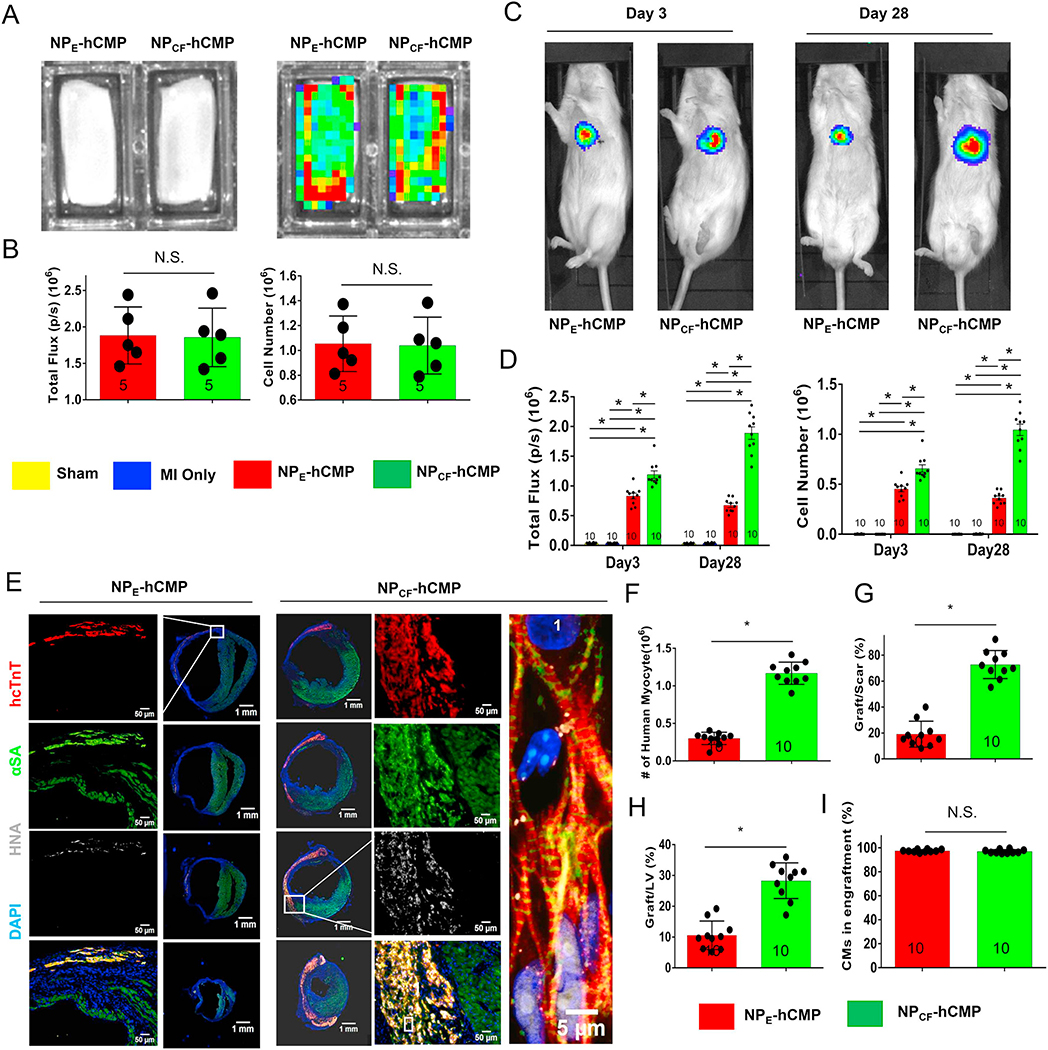
Fig. 2.
hiPSC-CM engraftment was greater in the hearts of mice treated with NPCF-hCMPs than with NPE-hCMPs after MI. Mice were randomly distributed into 5 experimental groups. One group underwent Sham surgery, and the other 4 groups underwent MI induction surgery followed by treatment with hCMPs composed of hiPSC-CMs and nanoparticles that contained CHIR99021 and FGF1 (the NPCF-hCMP group), with hCMPs composed of hiPSC-CMs and empty nanoparticles (the NPE-hCMP group); with patches containing the CHIR99021/FGF-loaded nanoparticles but lacking hiPSC-CMs (the NPCF-Patch group), or patches lacking both the nanoparticles and cells (the E-Patch group). The hiPSC-CMs carried a luciferase reporter plasmid and were of human origin; thus, engraftment was evaluated via (A–D) bioluminescence imaging (BLI) and (E–F) by identifying cells that expressed the human variant of cardiac troponin T (hcTnT) and human nuclear antigen (HNA). (A) Photographic (left) and BLI (right) images of NPE-hCMPs and NPCF-hCMPs were taken 1 week before transplantation, and (B) BLI signal intensity (left) was measured and compared to a standard curve to determine the total number of hiPSC-CMs (right). (C) Three and 28 days after MI induction and treatment, mice in the NPE-hCMP and NPCF-hCMP groups were injected with luciferin, and BLI images were collected 10 min later; then, (D) BLI signal intensity (left) was measured and compared to a standard curve to determine the number of engrafted cells. (E) Serial sections from the hearts of NPE-hCMP and NPCF-hCMP mice that had been sacrificed 4 weeks after MI induction and treatment were stained for the presence of hcTnT, HNA, and α sarcomeric actin (αSA) and nuclei were counterstained with DAPI; then, (F) engraftment was quantified by counting the number of cells that expressed both hcTnT and HNA. (G–H) The area occupied by the engrafted cells was measured and expressed as a percentage of the area of (G) the scar and (H) the left ventricle. (I) Cells that expressed HNA and both HNA and hcTnT were counted; then, the proportion of transplanted cells that displayed a cardiomyocyte identity was calculated as the ratio of double-positive to HNA-positive cells and expressed as a percentage. The number of animals evaluated for each treatment group is displayed at the base of the corresponding column. Five randomly selected viewing fields were evaluated per section and twenty sections were evaluated per animal. *p < .01, two-way ANOVA with Sidak correction for multiple comparisons in panel D; *p < .01, two-tailed Student’s t-test for panels B and F–I.

