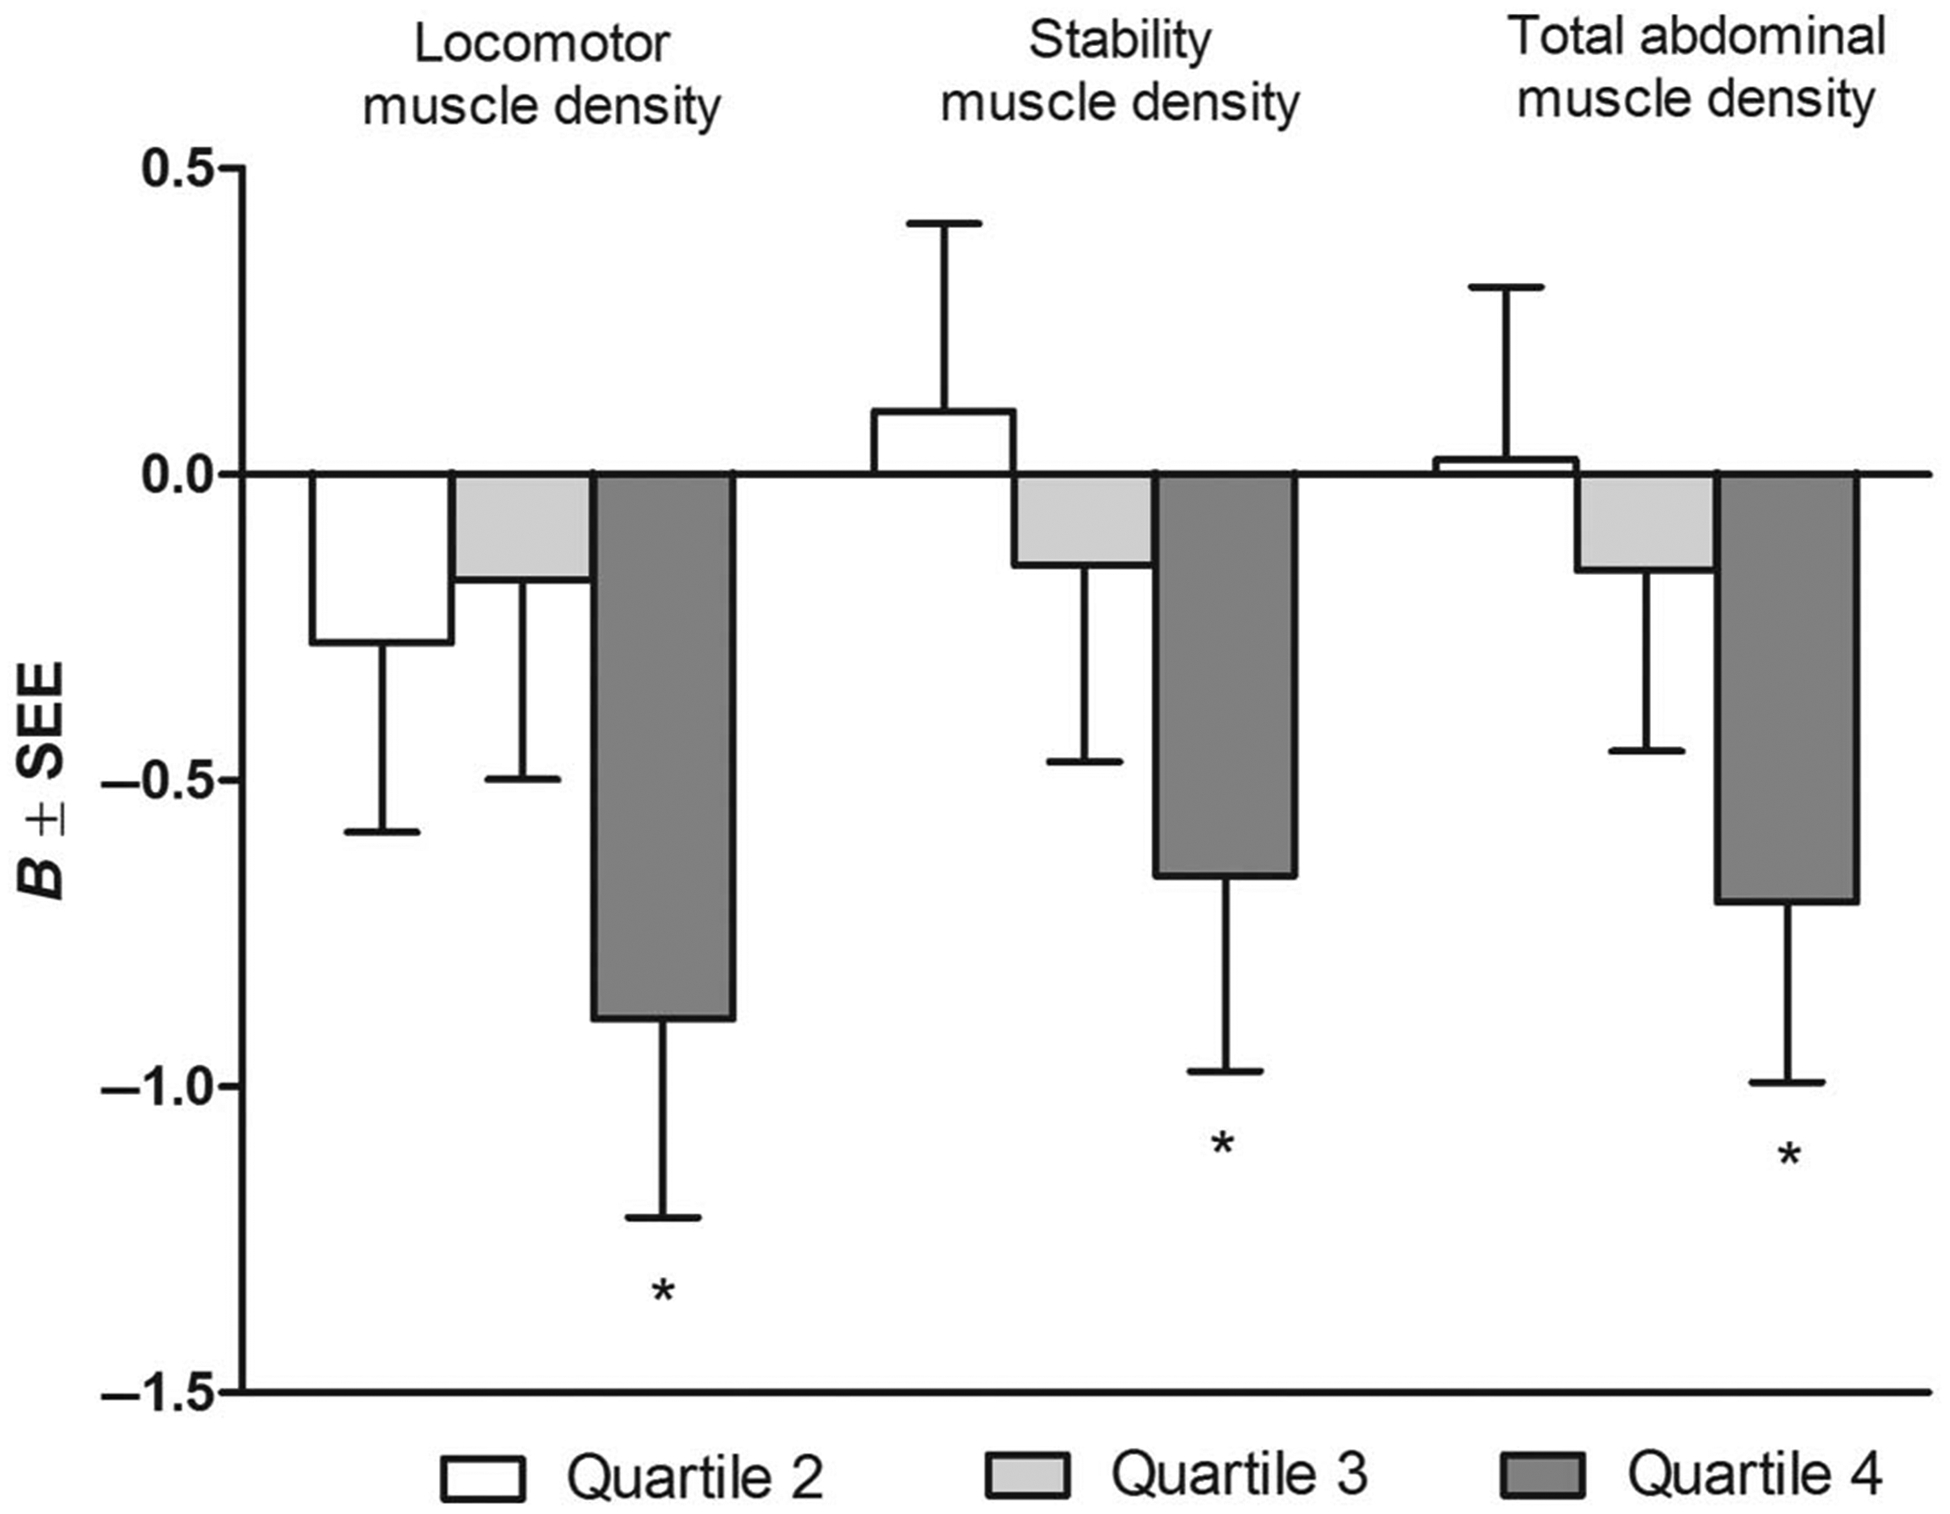
Figure 1 —

Multivariable-adjusted associations between quartiles of sedentary behavior and muscle density. Referent category: Quartile 1. Quartile cutpoints (MET h·wk−1): Q1 < 14, Q2 = 14–24.5, Q3 = 24.6–38, Q4 > 38. Adjusted for age, sex, race/ethnicity, and MVPA. B indicates slope; SEE, standard error of the estimate. *P < .05.
