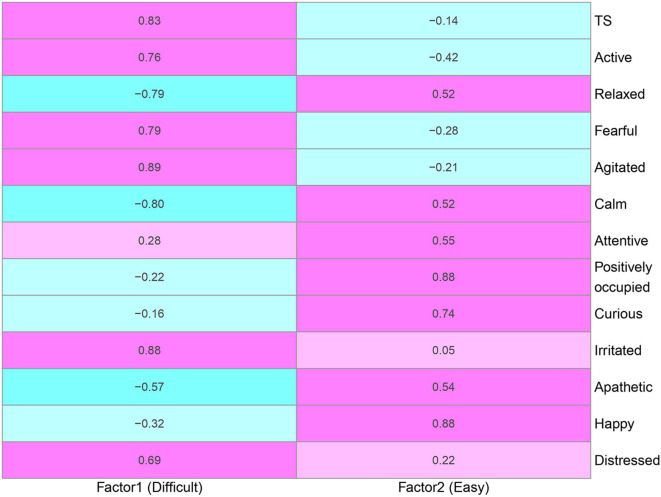
Figure 3.
Factor loadings between factors and phenotypes derived from the explanatory factor analysis using temperament score (TS) and 12 qualitative behavior assessment attributes. Positive and negative relationships are denoted as pink and blue, respectively. Factors 1 and 2 are labeled as Difficult and Easy because of positive loadings on negative and positive temperament attributes, respectively. The degree of shading corresponds to the intensity of the relationships.

