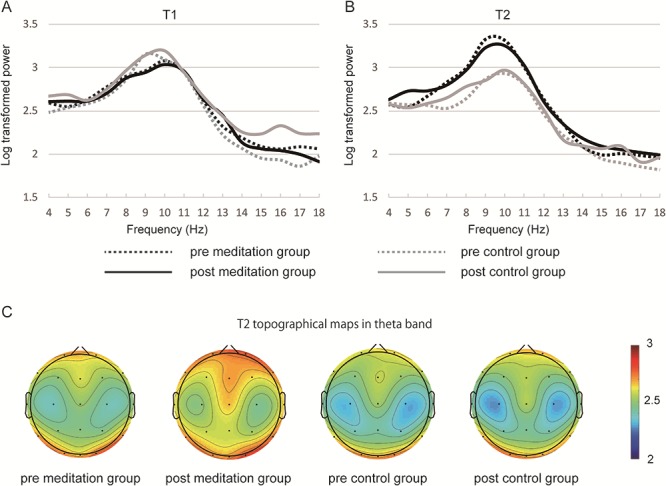
Fig. 2.

Fast Fourier transform (FFT) results. The power spectrum at Fz in T1 (A) and T2 (B) condition is shown. The topographical map in theta band in T2 condition (C) shows an increase of frontal theta band power spectrum in the post-training meditation group, but the result was not statistically significant. Heatmap indicates log-transformed power spectrum.
