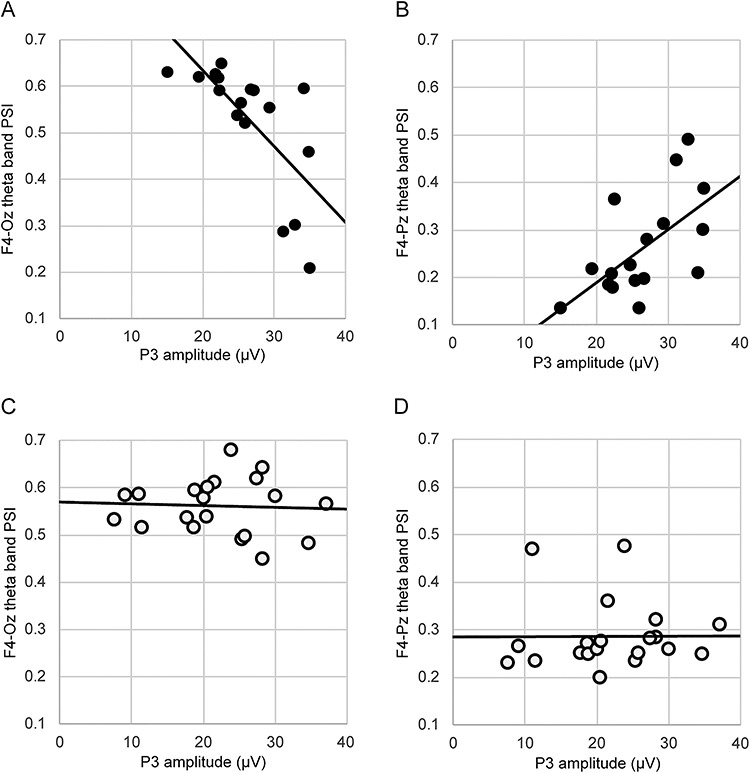
Fig. 3.

The results of correlation analysis between P3 amplitude at the time of responding to target stimuli and theta band phase synchrony index (PSI) during resting state or focused attention meditation (FAM) in post-training T2 condition. (A) indicates significant negative correlation between P3 amplitude and F4-Oz theta band PSI during FAM. (B) indicates significant positive correlation between P3 amplitude and F4-Pz theta band PSI during FAM. (C) indicates the correlation between P3 amplitude and F4-Oz theta band PSI during resting state. (D) indicates the correlation between P3 amplitude and F4-Pz theta band PSI during resting state. Black and white dots indicate meditation and control groups, respectively.
