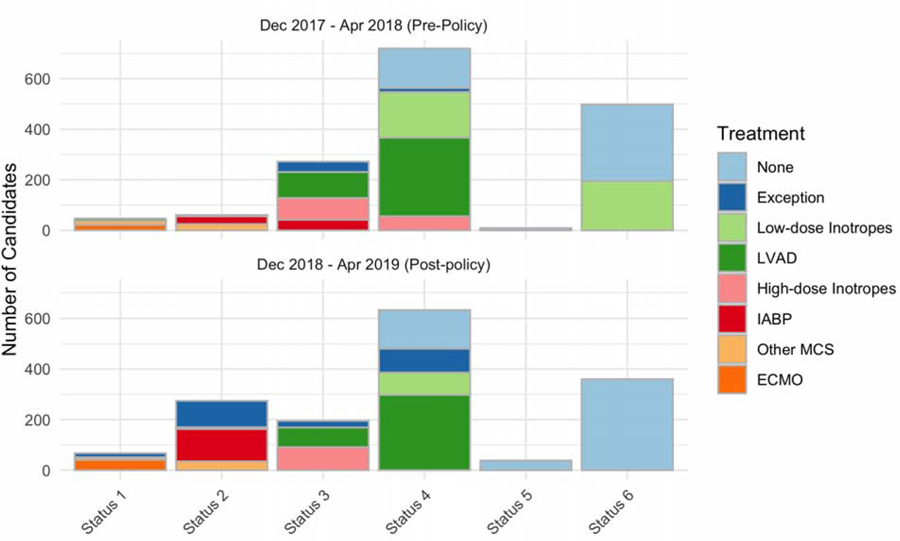
Figure 1: Predicted and Observed Status Distribution in the New US Heart Allocation System.

Predicted (top) Status distribution was created by applying the Status 1–6 listing criteria to the seasonally matched pre-policy cohort. Observed (bottom) Status distribution is histogram of actual listing Statuses utilized during the post-policy cohort. See supplement for details regarding classification of the pre-policy cohort into Statuses 1–6. Colors correspond to the treatment listed on the justification form for each status level.
