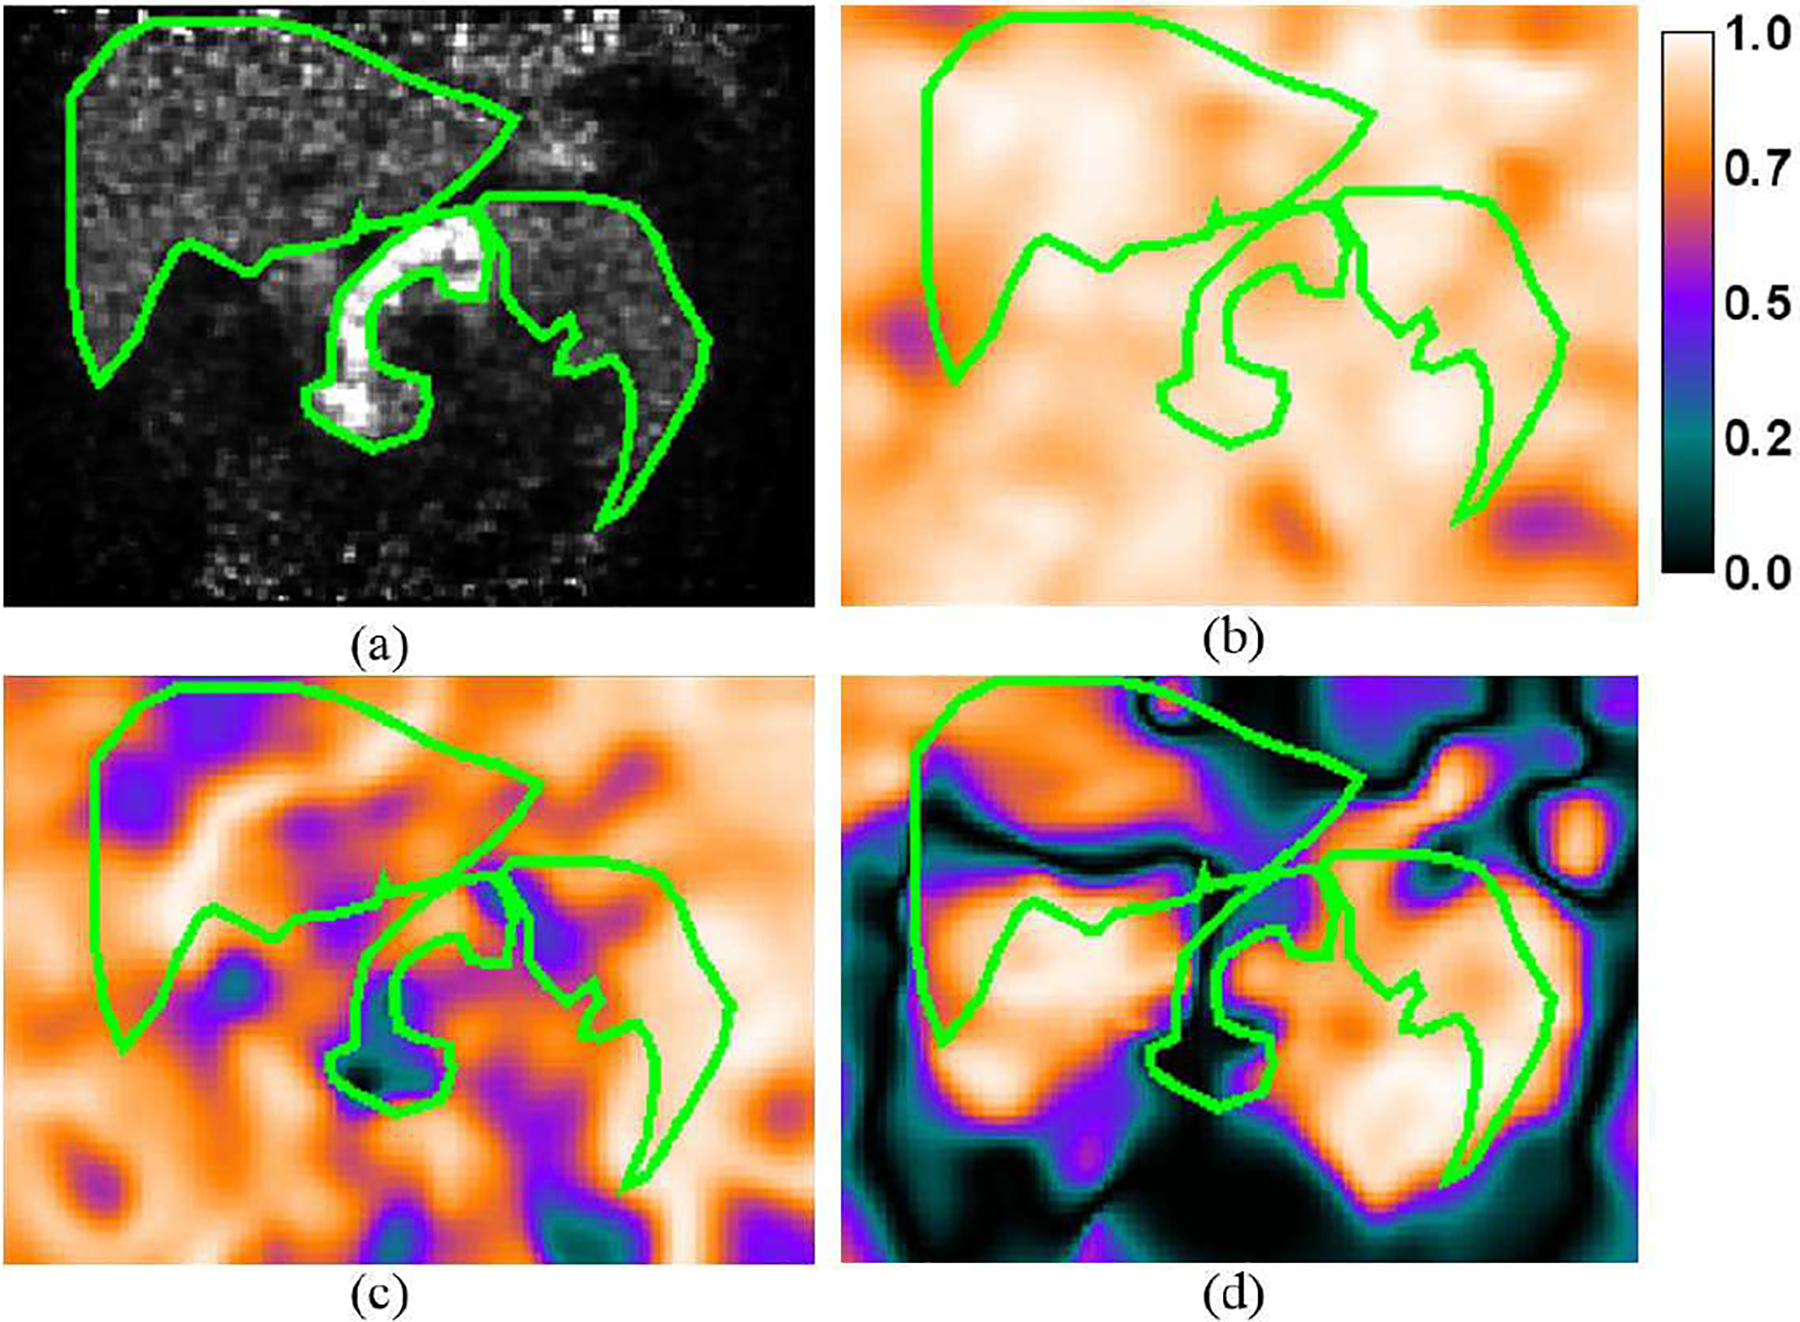
Fig. 6.

(a) A sample coronal slice of the gated reconstruction of a 18F-FP-DTBZ study showing elevated radiotracer uptake in the pancreas. The contours of the liver, pancreas and spleen are highlighted in green color. Maps of R2 (goodness of fit) in the (b) SI, (c) AP, and (d) LR directions overlaid by the contours of the organs.
