
Figure 4. Effects of direct membrane potential change on ArcLight fluorescence intensity in ArcLight-CMs.
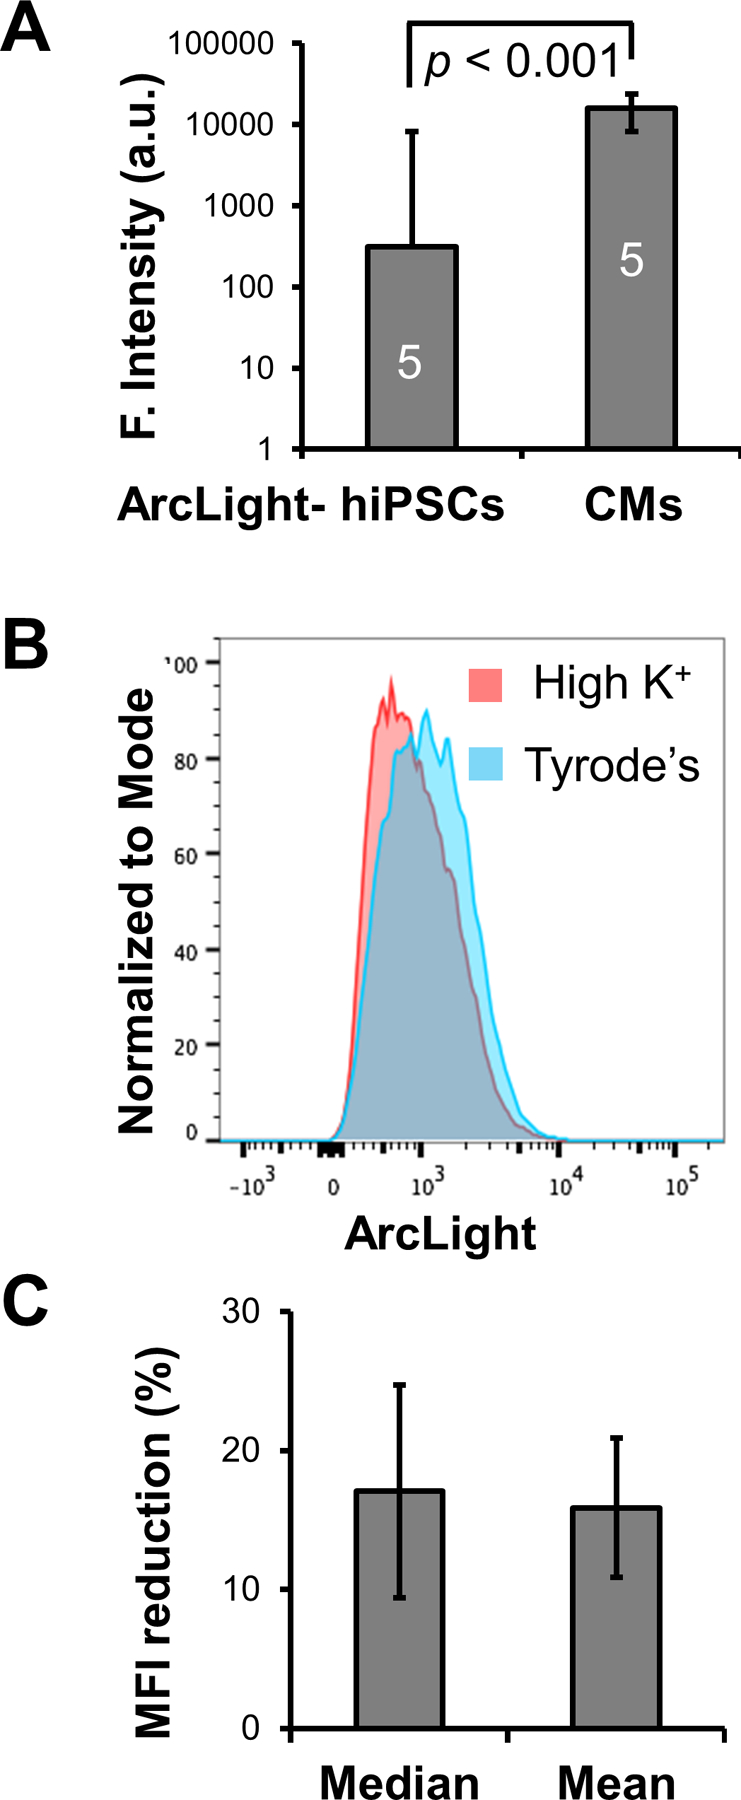
(A) ArcLight-CMs are significantly brighter in ArcLight fluorescence than ArcLight-hiPSCs. Five fields of confluent ArcLight-hiPSCs or ArcLight-hiPSC-CMs of D40 after differentiation were imaged under identical optical settings. ArcLight intensity are quantified in arbitrary units (a.u.) and presented as Mean ± SE. Statistic difference was analyzed by unpaired two-tail Student’s t-test. (B) A representative histogram of fluorescence intensity of live ArcLight-CMs in Tyrode’s or high K+ solution. Note the significant reduction in the median ArcLight fluorescence intensity due to depolarization of the membrane potential induced by concentrated K+. (C) Quantification of median or mean fluorescence intensity (MFI) reduction after treatment of high K+ solution relative to Tyrode’s solution. Date is presented as geometric Mean ± SE from 3 independent FACS experiments.