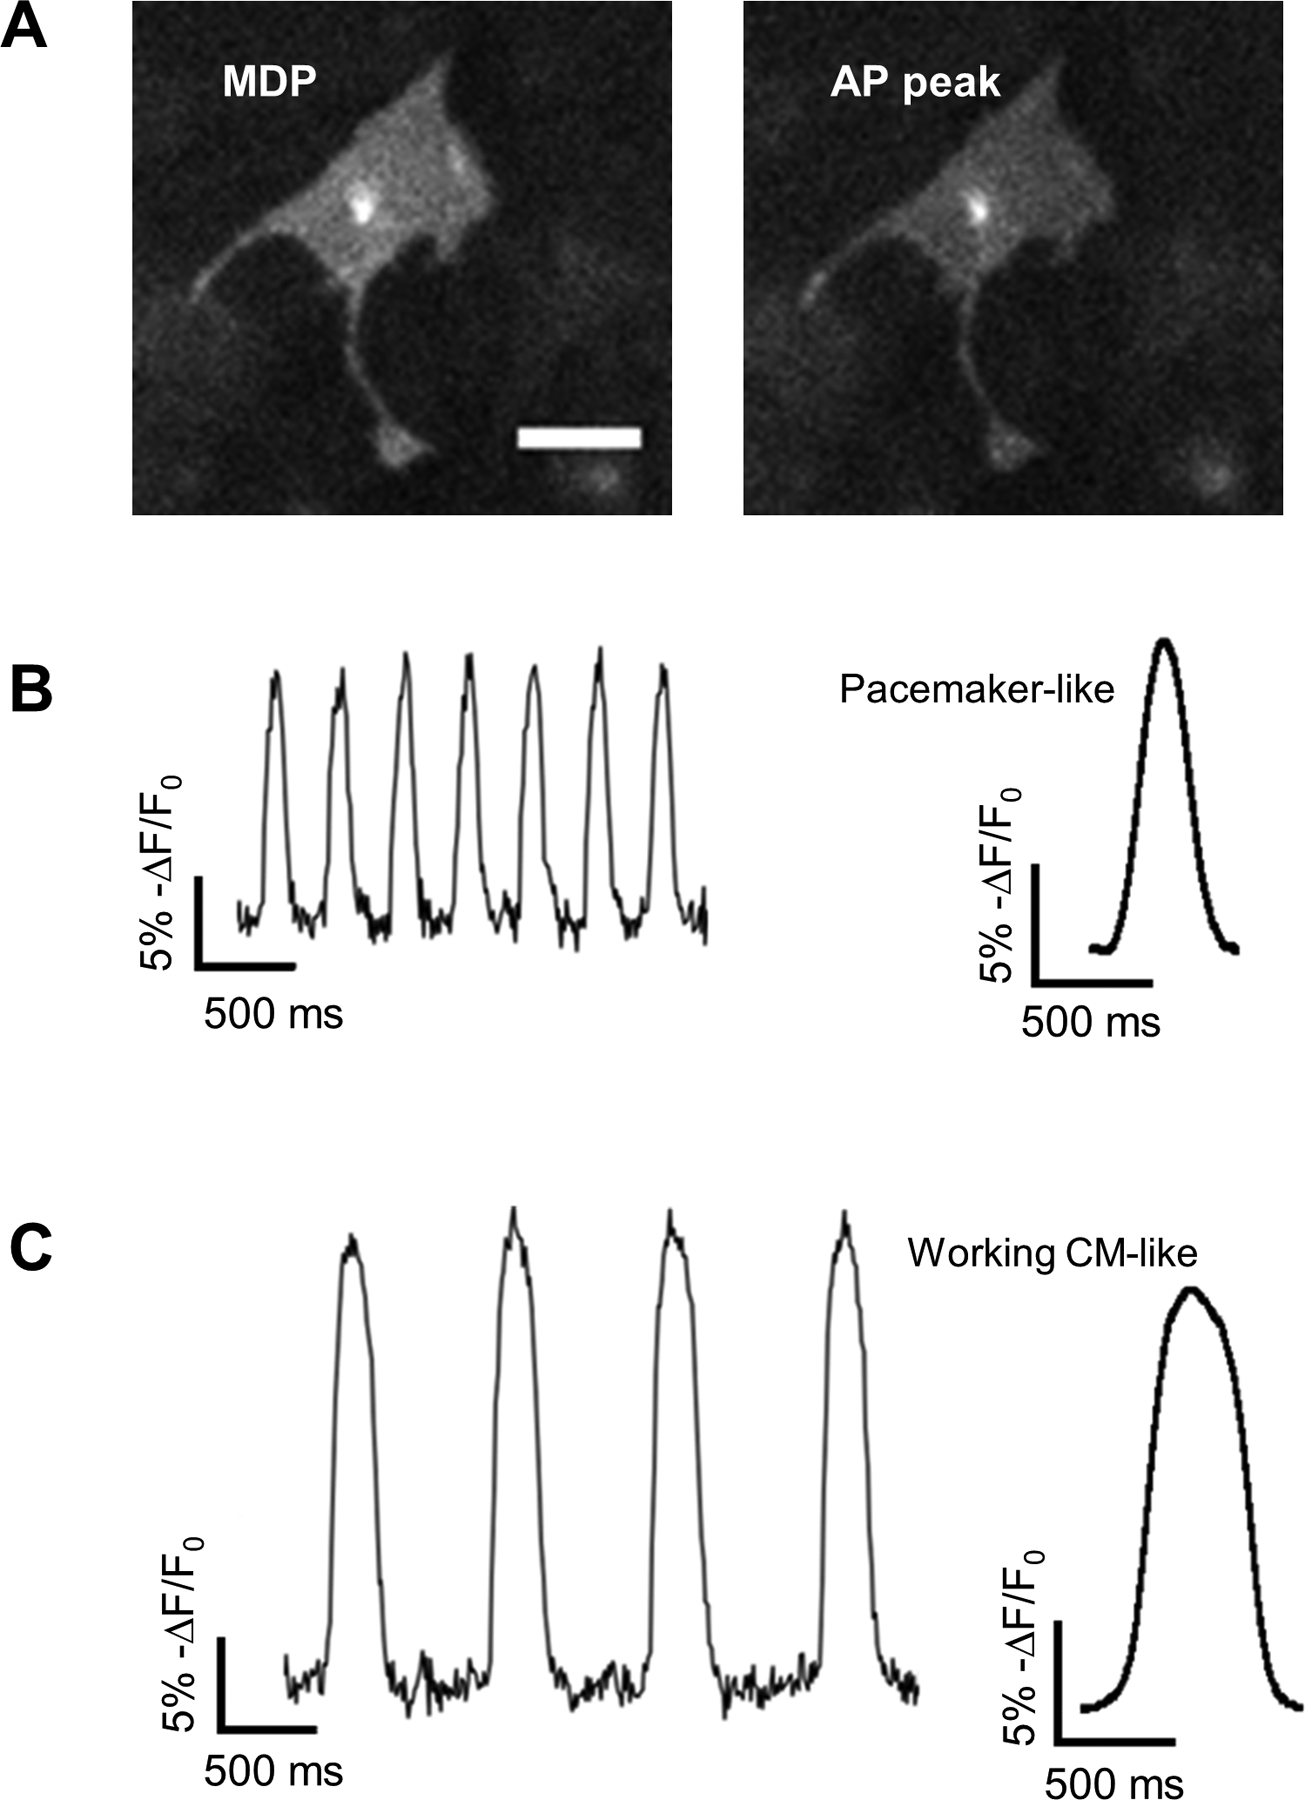
Figure 5. Optical recordings of APs in ArcLight-CMs.

(A) Representative images of ArcLight-CMs with maximum diastolic potential (MDP) or AP peak show reduction of ArcLight fluorescence intensity with depolarization. Scale bar, 50 μm. (B) Traces recorded from a typical pacemaker-like APs (left) and averaged AP profile from the traces (right). (C) Traces recorded from a typical working CM-like APs (left) and averaged AP profile from the traces (right).
