
Figure 6. AP parameters from two distinct AP types of ArcLight-CMs.
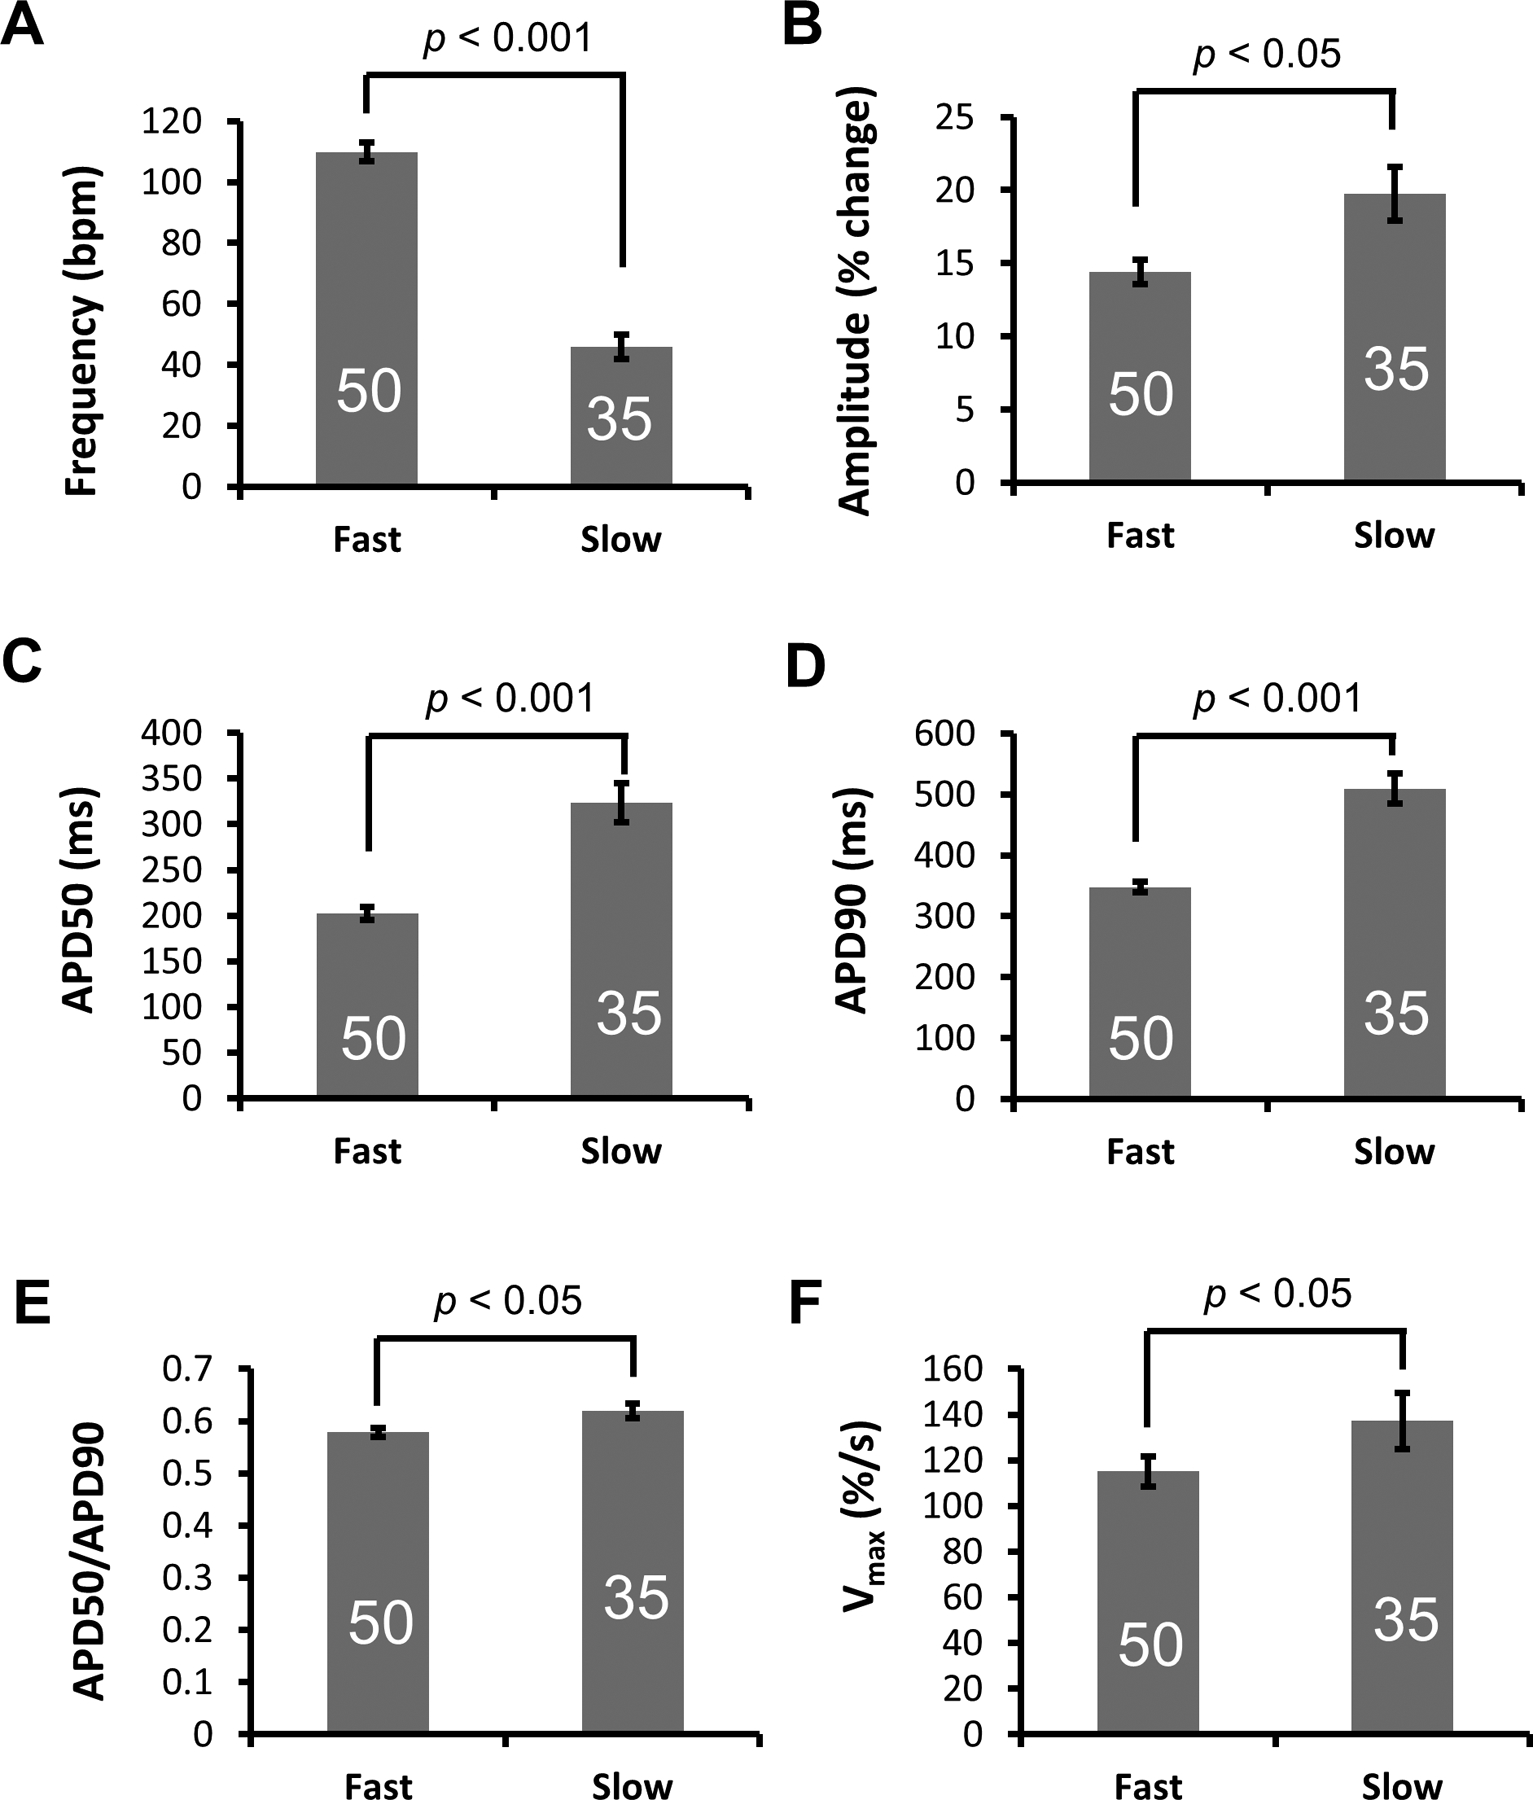
(A) Frequency, (B) Amplitude, (C) APD50, (D) APD90, (E) Ratio of APD50/APD90 and (F) Vmax (ΔF/Δtmax) of fast and slow APs recorded from ArcLight-CMs. Data is presented as Mean ± SE. The number of CMs sampled is indicated inside each bar. Statistical differences were analyzed by unpaired two-tail Student’s t-test.