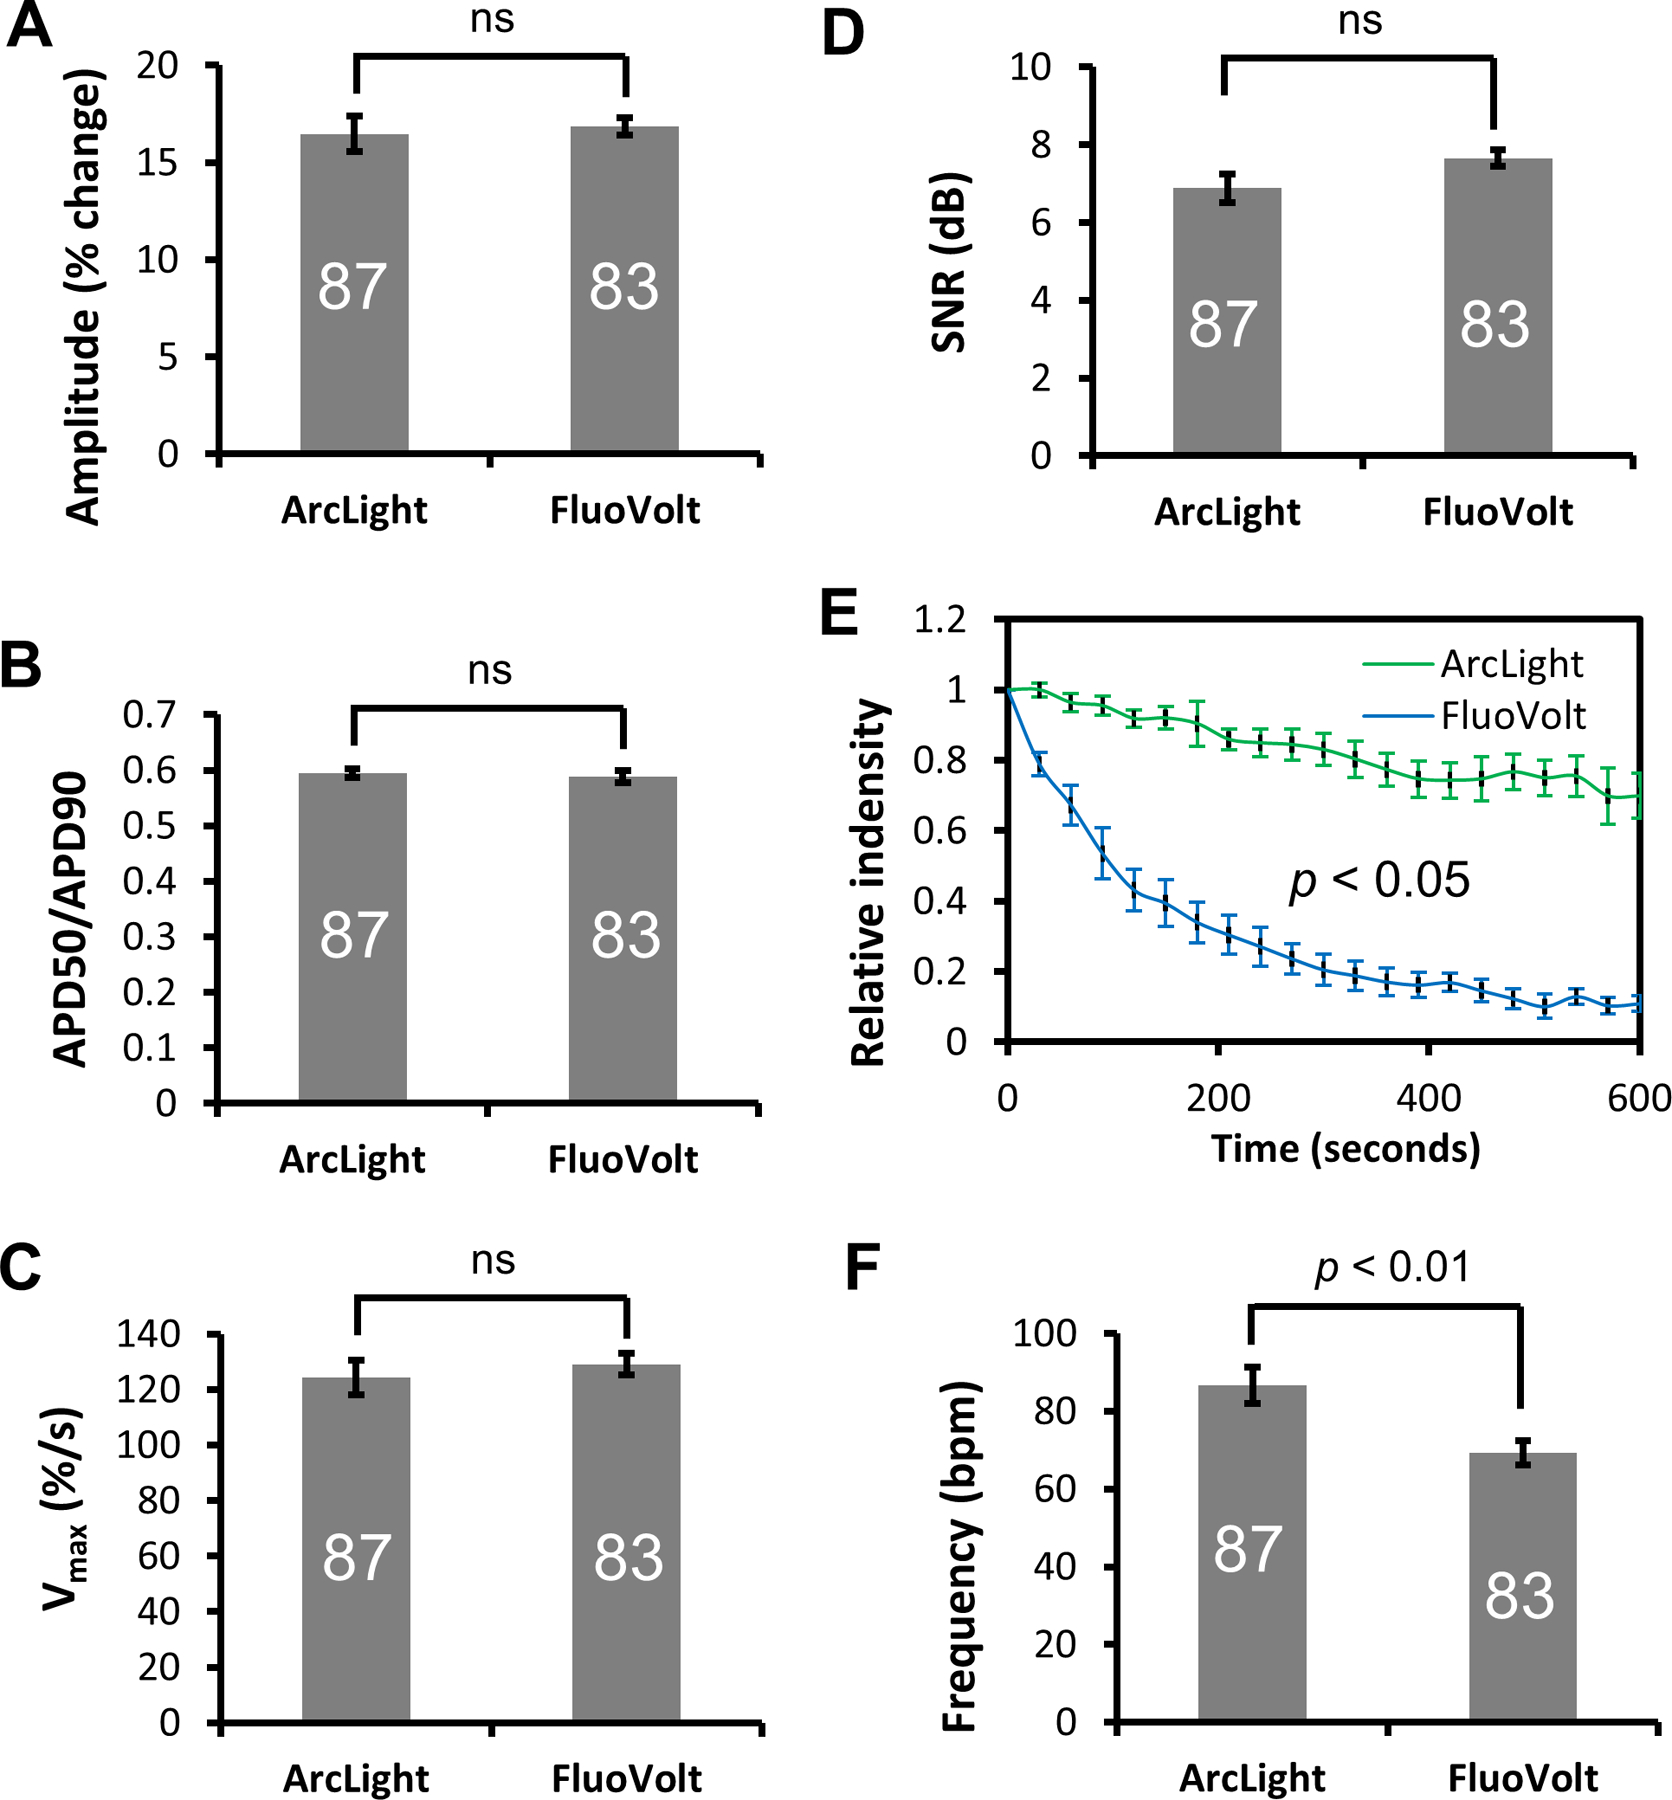
Figure 7. Comparison of APs recorded with ArcLight reporter or FluoVolt voltage-sensitive dye.

(A) Amplitude, (B) Ratio of APD50/APD90, (C) Vmax, and (D) Signal-to-noise ratio (SNR) of APs recorded with ArcLight reporter or FluoVolt are similar. (E) Head-to-head comparison of photo bleaching between ArcLight-CMs and FluoVolt-stained CMs under identical conditions. Experiments were done in full power of the illuminator. Data is presented as Mean ± SE of normalized relative fluorescence intensities as a function of time. (F) Automaticity frequency of hiPSC-CMs recorded with FuoVolt were significantly slower than those recorded with ArcLight. Data is presented as Mean ± SE. The number of CMs sampled is indicated inside each bar, except for the photobleaching experiments in E with n of 5. Statistical differences were analyzed by unpaired two-tail Student’s t-test, except for E, which was analyzed by Two-Way ANOVA. ns, not significant.
