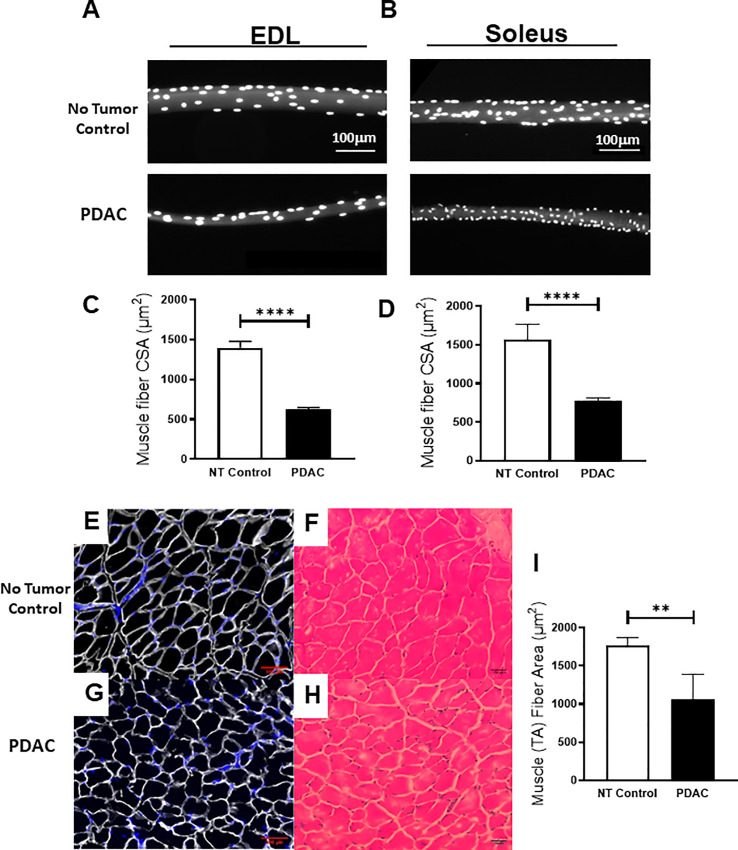
Fig 4. Histologic confirmation of skeletal muscle fiber atrophy in terminal mice with PDAC.
Following euthanasia, the EDL and SOL muscles were harvested from PDAC baring and NTC mice and stained with DAPI for calculation of CSA (100 fibers per mouse). TA muscles were dissected and weighed. After which, TA muscles were frozen and stained with Laminin and H&E, and CSA was measured. Photomicrographs (10x) show representative DAPI stained (A) EDL and (B) SOL muscle fibers at the time of sacrifice from NT (n = 5) and PDAC baring mice (n = 5), with quantification of (C) EDL and (D) SOL CSA (a significant difference was found between NTC and PDAC mice, using Student’s t-test, mean ± SD ****p<0.0001). Images (10x) of laminin and H&E stained TA cross-sections of (E,F) NTC and (G,H) PDAC are shown, respectively, along with quantification of TA (I) CSA (μm2) (n = 5) and are presented with the mean ± SD (a significant difference was found between NTC and PDAC mice, using Student’s t-test, mean ± SD **p<0.01).

