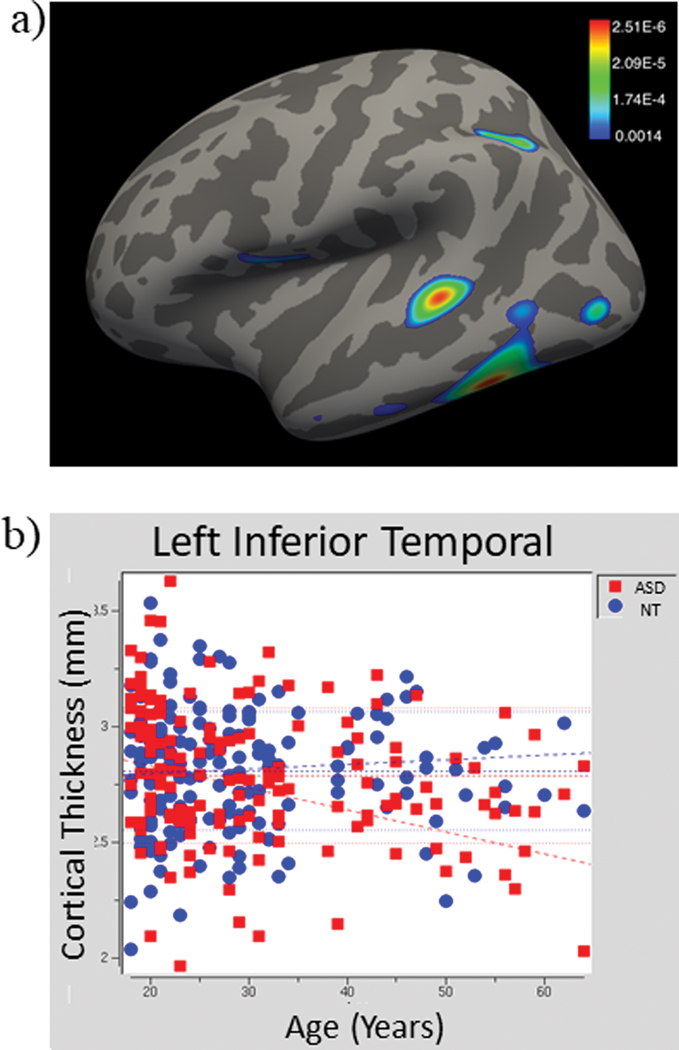
Fig. 1:
(a) Areas where the relationship between cortical thickness and age are significantly (p < 0.05, false discovery rate corrected) different between the ASD and NT groups on the left lateral surface. (c) A representative significant cluster (left inferior temporal gyrus) showing a negative correlation with age in the ASD group and no correlation in the NT group.

