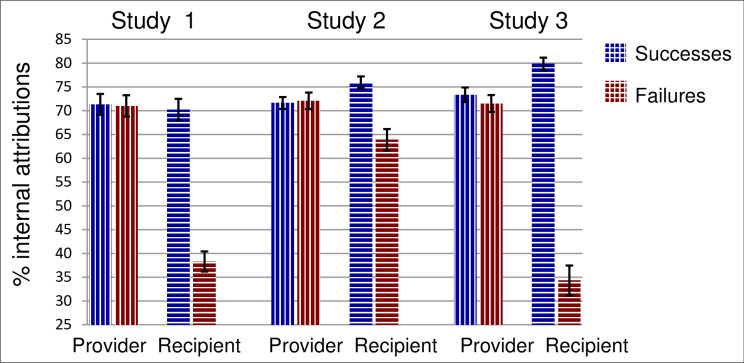
Fig 3. Percent of performance attributions to internal causes in Studies 1, 2, and 3.
Results are shown by role (provider vs. recipient of feedback) and valence/outcomes (positive feedback for successes vs. negative feedback for failures), following feedback conversation. Error bars show standard errors.

