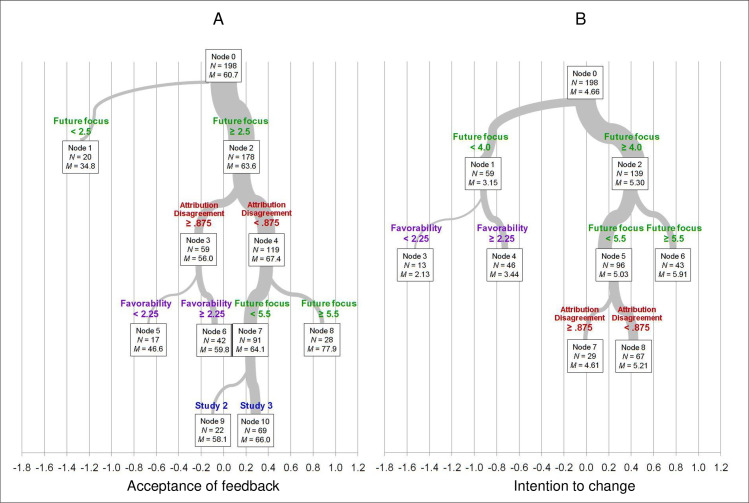
Fig 6. Regression trees for recipients’ ratings of feedback acceptance (0–100) and intention to change (1–7).
The trees depict the effects of future focus, attribution disagreement, and feedback favorability on our two measures of feedback effectiveness. The width of branches is proportional to the number of participants in that branch. Node 0 is the full sample of 198. Values on the X axis are standardized values for each dependent measure. Data are from Studies 2 and 3.

