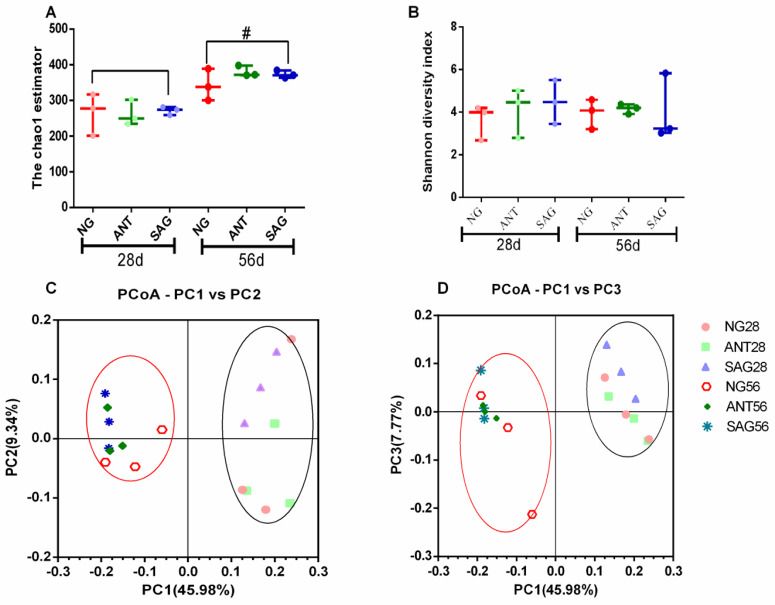
Fig 3. Effect of sanguinarine on bacterial communities’ diversity in cecal of yellow-feathered broilers.
(A, B) Cecal taxa richness assessed by α-diversity analyses using chao1and Shannon method. (C,D) Cecal microbial community β-diversity (unweighted Unifrac, P>0.05), which was demonstrated using principal coordinates analysis (PCoA) of the unweighted Unifrac distance matrices. Microbial communities clustered according to the stage (28d vs 56d); however, there was no obvious clustering according to sanguinarine supplementation. Percent of dataset variability explained by each principal coordinate is shown in the axes titles. # represents p < 0.05 compared with the early stage (28d) and later stage (56d). Each dot represents one sample and each group is denoted by a different color and shape. NG: basal diet; SAG: sanguinarine supplemented with 0.7 mg/kg of diet; ANT: basal diet group with 50mg/Kg BMD.

