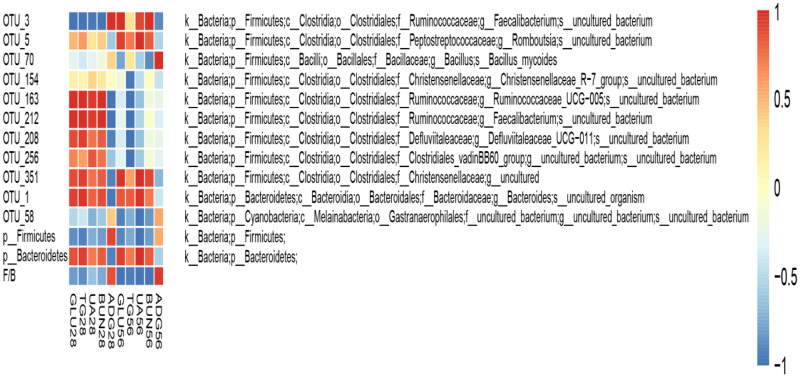
Fig 5. Relationships between the bacterial abundance and the metabolic parameters.
Heat map of 11 OTUs and phylum, which were significantly associated with some metabolic parameters altered as determined by Spearman’s correlation coefficient. These 11OTUs were selected from the 39 OTUs which had significant changes between each group (in Fig 3). The red and blue colors indicate the correlation between the corresponding metabolic parameters and bacterial abundance. ADG: average daily body weight gain; BUN: blood urea nitrogen; UA: uric acid; TG: triglycerides; GLU: glucose; F/B: the ratio of Firmicutes/ Bacteroidetes.

