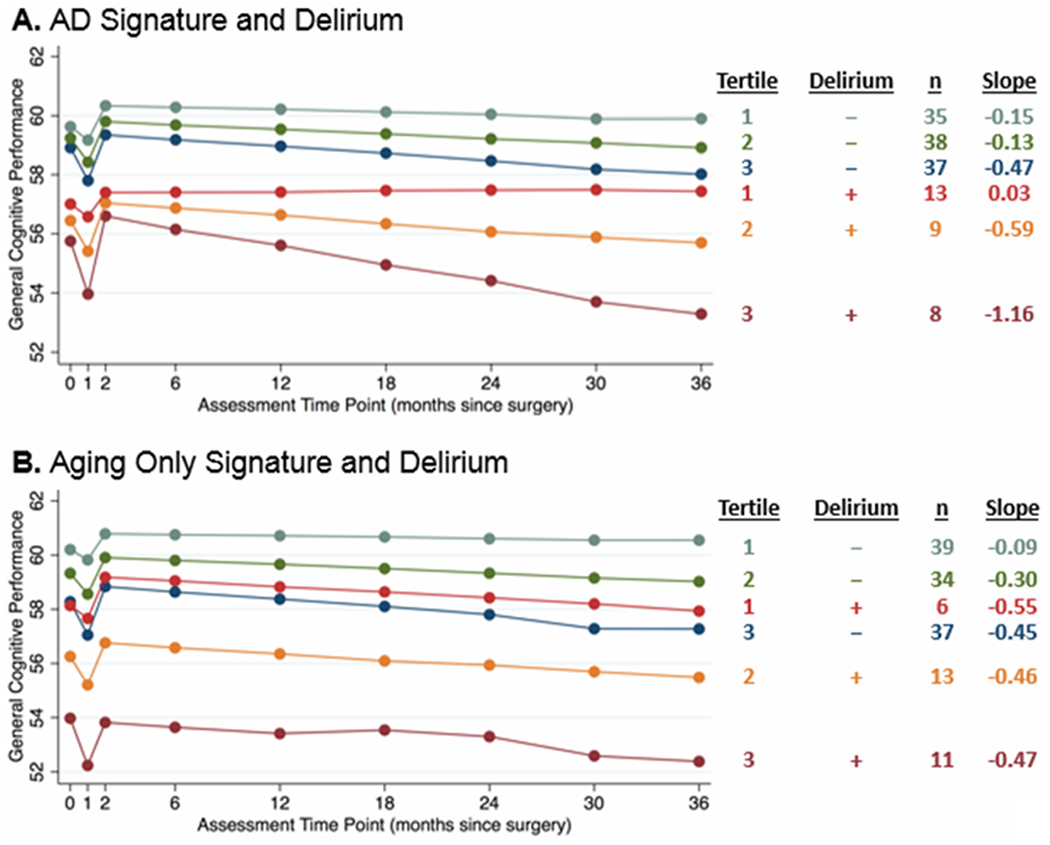
Figure 1. Group effects of cortical atrophy due to AD (A) or aging (B) and post-operative delirium on short- and long-term change in general cognitive performance after surgery.

The cortical signatures were analyzed as continuous variables, but for illustration purposes, results are displayed by groups based on cortical signature tertiles (tertile 1 has the thickest cortex, tertile 3 has the thinnest cortex, interpreted as the greatest atrophy) and delirium (present [+] or absent [−]). Tertiles are generated separately for AD signature and for Aging-Only signature measures, leading to slight differences in group size. Estimated slopes are reported based on model coefficients and average cortical thickness in the respective tertile.
