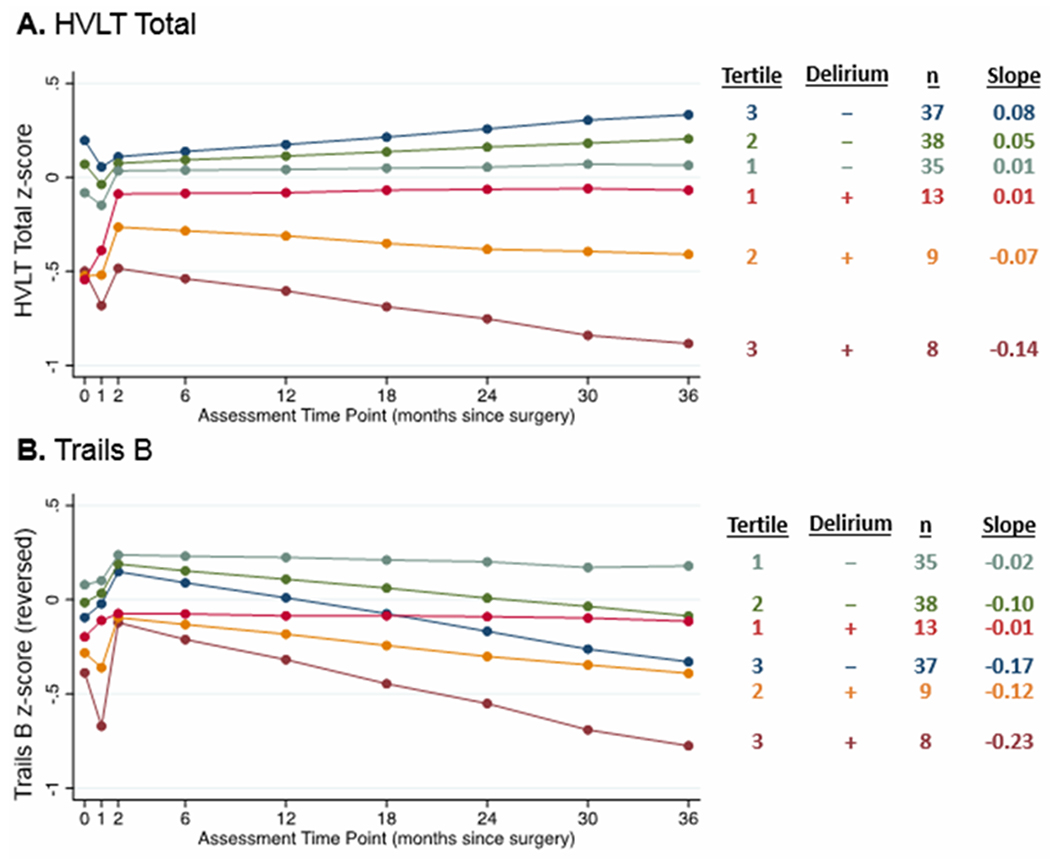
Figure 2. Group effects of cortical atrophy due to AD and post-operative delirium on short- and long-term change on selected individual neuropsychological tests.

The cortical signatures were analyzed as continuous variables, but for illustration purposes, results are displayed by groups based on cortical signature tertiles (see Figure 1 for details) and delirium (present [+] or absent [−]). Estimated slopes are reported based on model coefficients and average cortical thickness in the respective tertile. (A) HVLT = Hopkins Verbal Learning Test – Revised total score. (B) Trails B = Trail Making Test B (reverse-scored so that lower numbers indicate worse performance). Neuropsychological tests were transformed into z-scores before being entered into the models.
