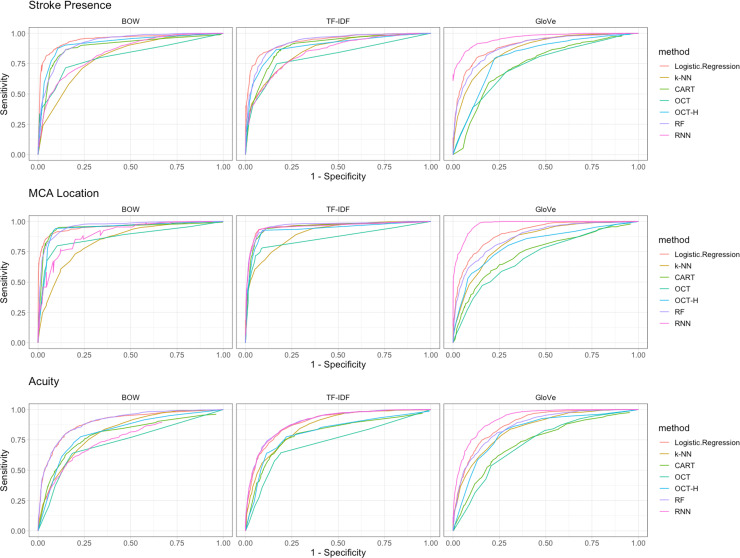
Fig 2. Receiver operating curves for NLP classification.
A, stroke presence; B, MCA location; C, acuity. These curves represent different combinations of text featurization (BOW, tf-idf, GloVe) and binary classification algorithms (Logistic Regression, k-NN, CART, OCT, OCT-H, RF, RNN). GloVe and RNN achieved the highest AUC for all three tasks (>90%). Similar results were achieved for simple tasks by BOW or tf-idf paired with Logistic Regression. The results presented average the mean sensitivity and specificity over five random splits of the data. In a ROC curve the true positive rate (Sensitivity) is plotted as a function of the false positive rate (1-Specificity) for different cut-off points of a parameter. Each point on the ROC curve represents a sensitivity/specificity pair corresponding to a particular decision threshold. The area under the ROC curve (AUC) is a measure of how well a parameter can distinguish between the two subpopulation groups.

