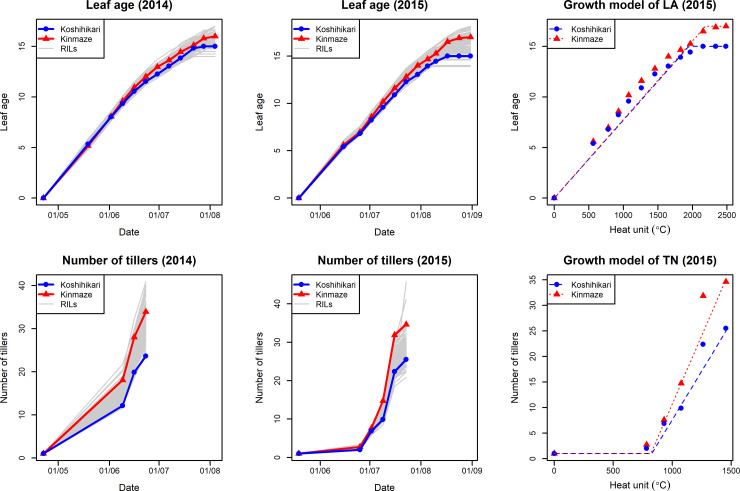
Fig 3. Growth curves and growth models of leaf age and number of tillers.
The line means of both traits in 2014 and 2015 are plotted in four figures in the left side. The parents, Koshihikari and Kinmaze, and RILs are expressed as blue, red and gray lines, respectively. The growth models of those traits are shown in two figures in the right side. The growth model and the observed values of parents in 2015 are shown. Heat unit is used as horizontal axes.

