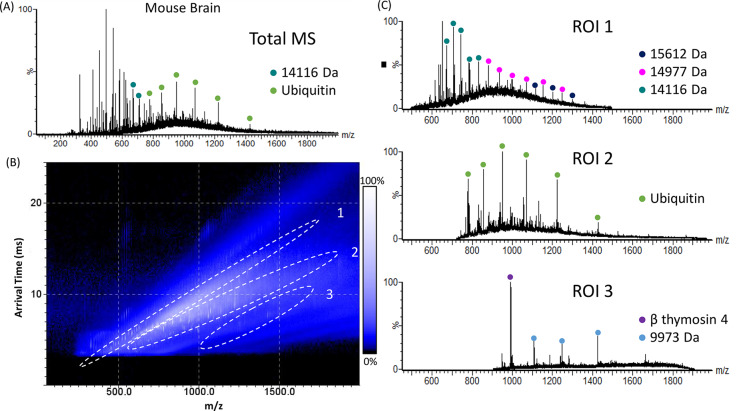
Figure 1.
LESA single-pass cIM-MS of mouse brain. (A) Total LESA mass spectrum (summed across the entire ATD). (B) 2D heat-map (arrival time vs m/z). Regions of interest (ROI) containing peaks corresponding to proteins are highlighted. (C) Mass spectra extracted from ROI 1, ROI 2, and ROI 3. Abundant proteins are indicated.

