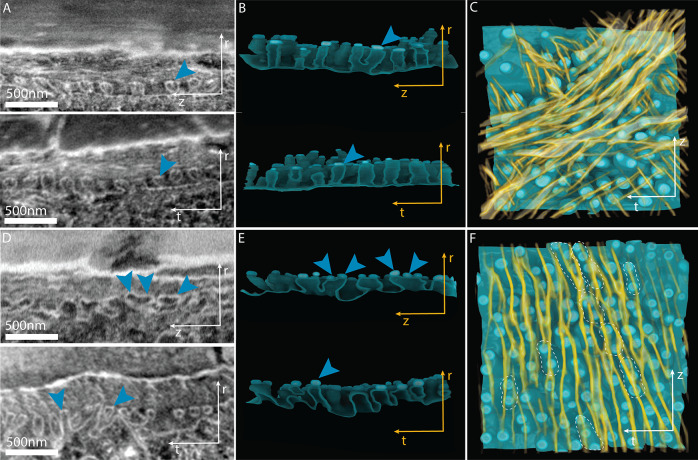
Figure 3.
Microvilli structure and fiber deposition within the assembly zone. FIB/SEM images (A, D) obtained by reslicing the 3D datasets shown in Figure 2 along (t) (top) and (z) (bottom) directions for Night (A) and Day (D) samples. The comparison shows that the microvilli have similar dimensions in (z) and (t) directions in the Night samples ((A) top and bottom), whereas they are elongated along the (z) direction in the Day samples ((D) top). The plaques are depicted in bright blue. (B, E) (zr) and (tr) plane views of resliced volumes. Only one plaque (bright blue arrowhead) is situated at the tips of each microvillus in Night samples (B), but two or three plaques are observed in the Day samples on top of microvilli merged along the (z) direction (E). (C, F) Three-dimensional volume rendering of the chitin fibers/fiber bundles (yellow) observed in the assembly zone and the apical cell surface in Night (C) and Day (F) samples. For simplicity, only half of the assembly zone thickness is shown. White dotted lines in (F) indicate merged microvilli structures.

