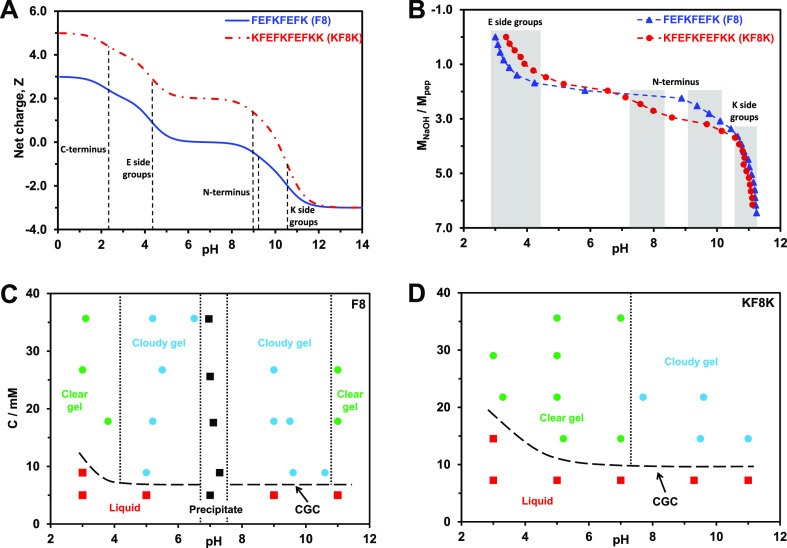
Figure 2.
(A) Theoretical charge carried by each peptide vs pH (dotted lines indicate the theoretical pKa of the different ionic groups present on the peptides); (B) molar ratio of added NaOH to peptide vs pH (shadowed regions indicate the protonation/deprotonation transition regions of the different ionic groups); (C,D) concentration vs pH phase diagrams describing the samples’ physical appearance/state.

