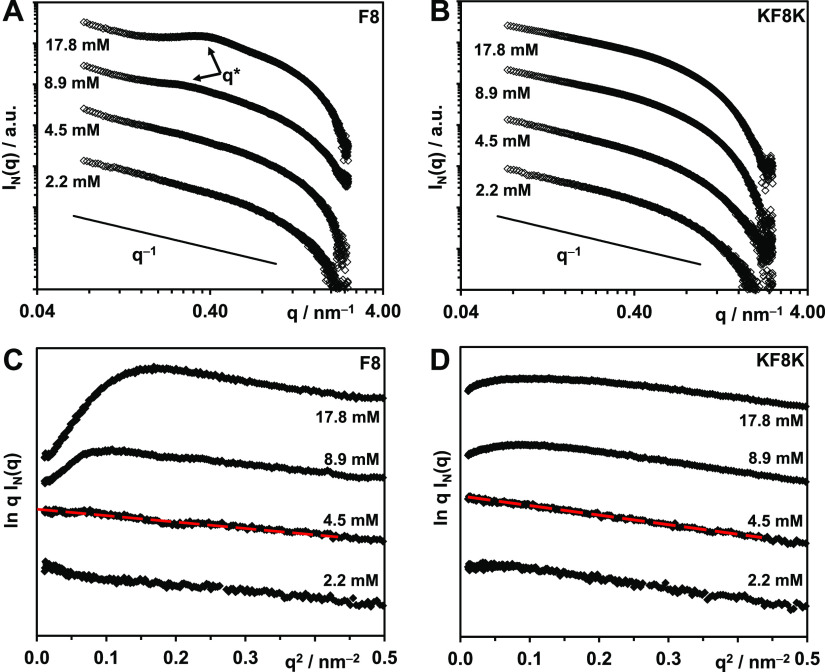
Figure 4.
(A,B) Double logarithmic plots of SAXS patterns obtained for F8 and KF8K samples prepared at different concentrations in In(q) vs q representation. (C,D) SAXS patterns of F8 and KF8K samples plotted for low q in a ln q I(q) vs q2 representation (red lines show the linear fits used to calculate the fiber cross-section radii of gyration, Rσ).

