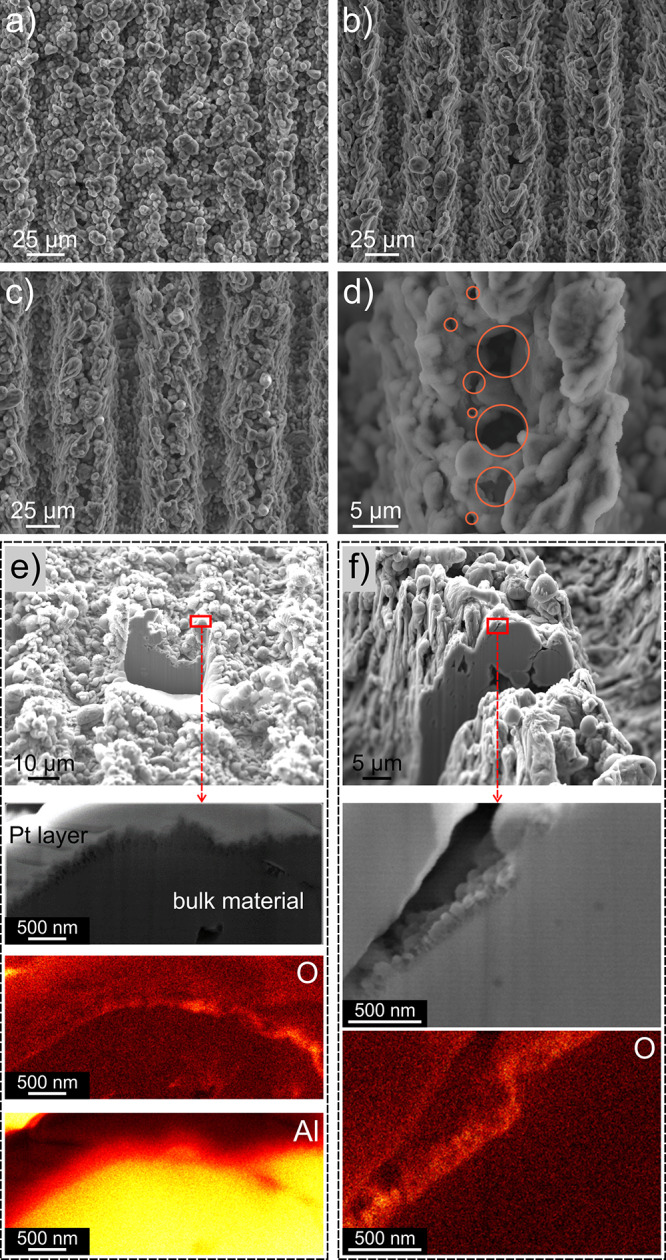
Figure 2.

SEM images of surface (a) HPI FT, (b) HPO VS 1, (c) HPO ES 1, and (d) examples of microcavities. (e) FIB cross section and EDS analysis of oxygen and aluminum concentration (the yellow color denotes a higher concentration) on surface HPO FT and (f) HPO VS. Note that FIB-milled surfaces are coated with a 0.5 μm Pt layer to keep the surface layer intact during ion sputtering.
