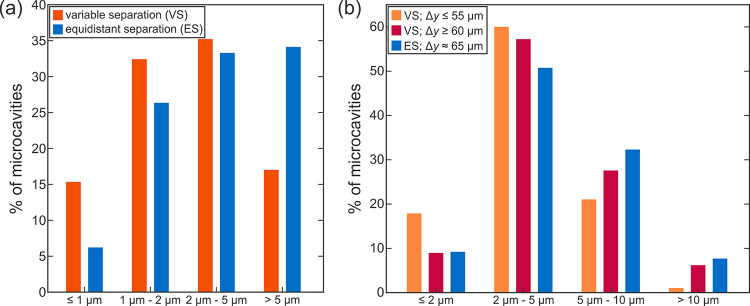
Figure 3.
(a) Distribution of microcavity mean diameters on VS and ES surfaces obtained through the analysis of high magnification SEM images and (b) distribution of microcavity mean diameters on laser-induced ridges, generated by a specific scanning line separation on VS and ES surfaces observed on low magnification SEM images.

