Figure 2.
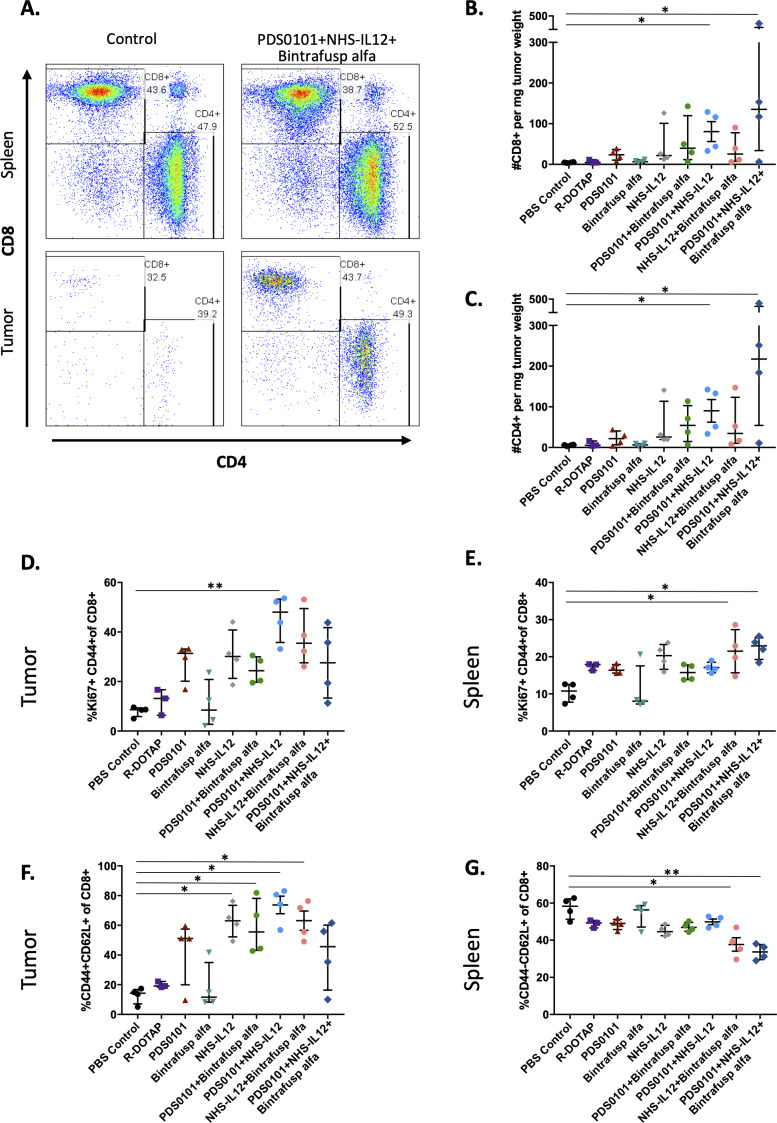
CD4 and CD8 T cell infiltration into tumors. TC-1 tumor bearing female C57BL/6J mice (n=4/group) were treated with PBS control (100 µL s.c.), R-DOTAP control (100 µg s.c.), PDS0101 (s.c., 3 weekly doses starting on day 7), bintrafusp alfa (250 µg, i.p., days 7, 9, and 11), and/or NHS-IL12 (50 µg, s.c., day 7). (A) Representative flow cytometry plots of CD4+ and CD8+ T cells in the spleen and tumor of PBS control treated mice, and PDS0101, NHS-IL12 plus bintrafusp alfa combination treated mice. (B) CD8+ T cell infiltration in tumor. (C) CD4+ T cell infiltration in tumor. (D) Activated and proliferating CD8+ T cells in tumor. (E) Activated and proliferating CD8+ T cells in spleen. (F) Activated effector CD8+ T cells in tumor. (G) Naïve CD8+ effector T cells in spleen. *P<0.05, **P<0.01. IL12, interleukin-12; i.p. intraperitoneally; s.c., subcutaneously.

