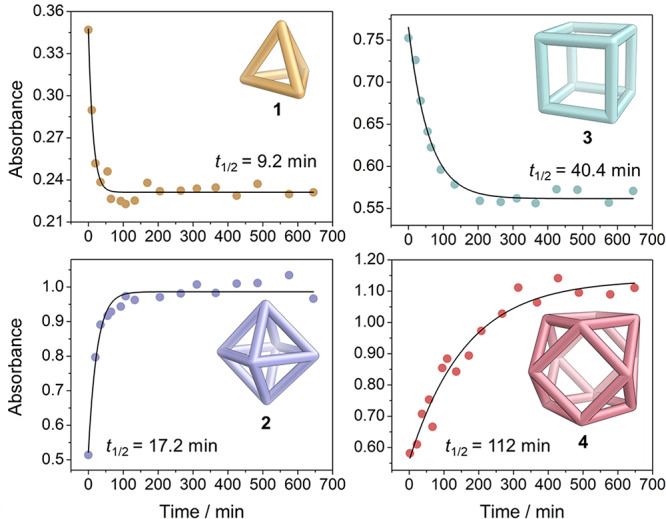
Figure 5.

Plots showing the rate of formation of each homoleptic architecture, monitored by UV–vis spectroscopy, following the principal optical bands of 1 (346 nm) and 2 (370 nm), and the MLCT transitions of 3 (430 nm) and 4 (445 nm), which overlapped with porphyrin Soret bands. Black lines represent the best fits to an exponential rate equation (Absorbance = A0 + Aeλt), from which t1/2 = ln 2/λ.
