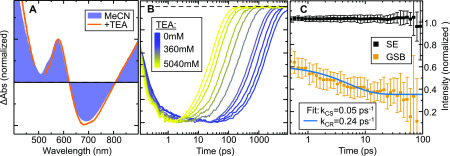
Figure 2.
(A) Normalized differential absorption spectra at 1 ps time delay in pure MeCN (blue) and with 4200 mM TEA (orange). (B) Normalized differential absorption transients in the stimulated emission (SE) region (700 nm) of 1 in MeCN for various concentrations of TEA from 0 mM (blue) to 5040 mM (yellow). (C) Differential absorption transients of 1 with TEA at a concentration of 4254 mM. Each transient has been divided by the stimulated emission intensity at the respective step. The GSB region was fit by a double-exponential function (blue line).

