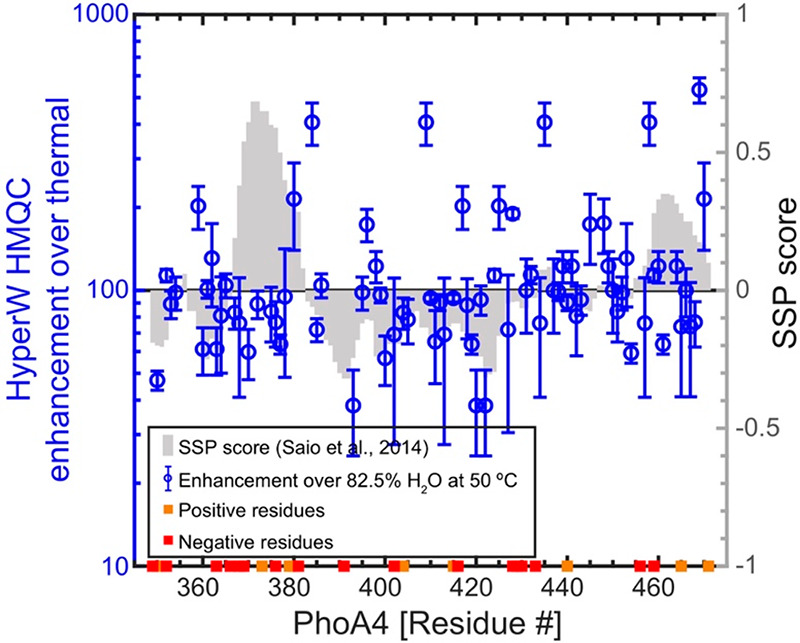
Figure 2.

HyperW HMQC sensitivity enhancements calculated for resolved residues in the 15N-labeled PhoA4 protein fragment. The sensitivity enhancements were extracted by comparing peak volumes between the HyperW HMQC spectrum (e.g., Figure 1, red) and thermal equilibrium spectra measured in an 82.5% H2O buffer (Figure S3). The values are averaged for three HyperW HMQC experiments, after normalizing to the H2O proton enhancement in each experiment; the “error bars” reflect the scattering obtained over the course of these repeated injections for each residue. Sensitivity enhancements compared against SSP scores (gray bars) given in the literature18 based on NMR 13Cα and 13Cβ chemical shifts. Charged residues are also mapped on the sequence with orange (positively charged) and red (negatively charged) squares.
