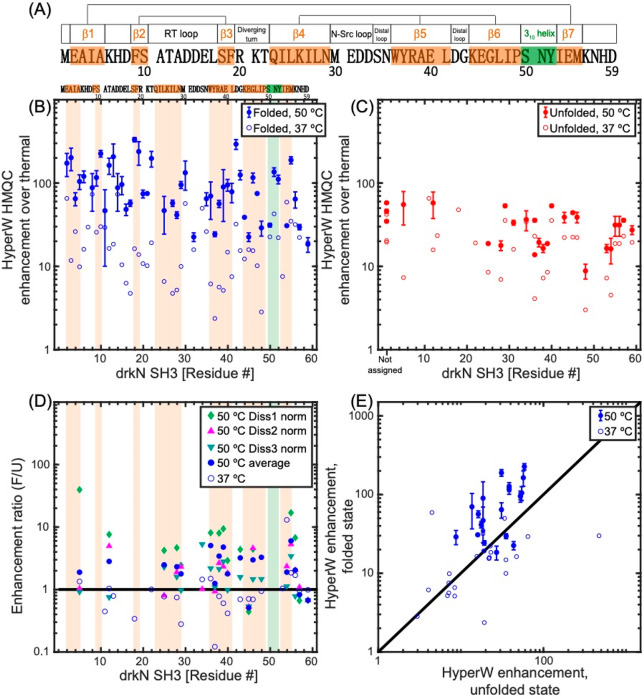
Figure 8.
(A) 59-residue drkN-SH3 domain sequence analyzed in this study. Secondary structure elements in the folded state (as measured at 20 °C62) are denoted above the sequence and shaded in orange (β-strands) and green (310 helix). Three β-sheets are formed in this small protein, and their β-strands are connected by straight lines in the cartoon. (B, C) HyperW HMQC sensitivity enhancements for assigned residues of the 15N-labeled drkN SH3 domain at 50 °C (full symbols) and 37 °C (open symbols). The sensitivity enhancements were calculated by comparing peak volumes between the HyperW HMQC spectrum (such as in Figure 7, red) and the thermal equilibrium spectrum measured for the same sample in ∼90% H2O buffer. The values at 50 °C are averages for three nominally identical HyperW HMQC experiments after normalizing to the H2O proton enhancement in each experiment, and the “error bars” denote the spreads observed in these experiments; only residues whose identity could be verified were included in the analysis (see SI Table S3 for further information). Sensitivity enhancements for the folded state are marked with blue circles (B), and those of the unfolded state are marked with red circles (C). (D, E) Different renderings of the observed experiments, showing the relative enhancement ratio of folded vs unfolded peaks in all the experiments recorded (D), and as correlations between the folded and unfolded enhancements observed in all the experiments at 37 and 50 °C (E). Orange and green shaded areas are drawn in (B, D) for regions which correspond to the secondary structure elements in (A).

