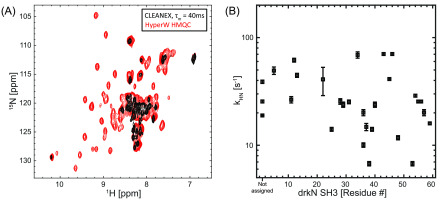
Figure 9.
(A) 1H–15N CLEANEX fast-HSQC spectrum with τm = 40 ms (black) and HyperW 1 H– 15N HMQC (red, taken from Figure 7C) measured on 15N-labeled drkN SH3. Notice how HyperW enhancements appear to correlate with CLEANEX-PM measurements for the unfolded state of the drkN SH3 domain. For the CLEANEX-PM measurements (black), one of the post-dissolution samples containing 160 μM drkN SH3 and ∼2.4% H2O buffer (50 mM HEPES, 50 mM KCl, pH 7.5) was lyophilized and subsequently reconstituted in the same volume with 90% H2O. For CLEANEX the indirect- and direct-domain spectral widths were 7211.5 and 2069.2 Hz, covered using 64 t1 hypercomplex increments and STATES acquisition.34NS = 128 scans were collected using a 142.0 ms acquisition time and a relaxation delay of d1 = 2 s. Total experimental time was ∼10 h for each different mixing time τm. For the HyperW HMQC, acquisition parameters were as in Figure 7C. All measurements were done at 50 °C on a 14.1 T Prodigy-equipped NMR spectrometer. (B) Amide proton exchange rates arising for different drkN SH3 residues in the unfolded state as extracted from CLEANEX-PM experiments at 14.1 T, 50 °C (black squares).

