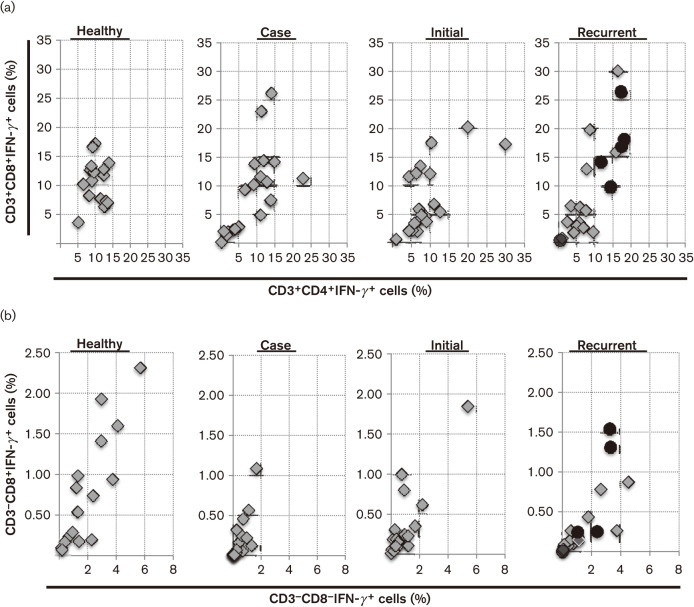
Fig. 4.
Determination of IFN-γ expression in gate 1 PBMC. (a) CD3+ data from each individual plotted as the percentage of CD3+CD4+IFN-γ+ vs CD3+CD8+IFN-γ+ PBMC in gate 1. Black circles in the recurrent subset of patients represent the six patients whose blood was taken at the time of primary CDI, but who later became recurrent. (b) CD3− data from each individual plotted as the percentage of CD3−CD8−IFN-γ+ vs CD3−CD8+IFN-γ+ PBMC in gate 1. Black circles represent the six patients whose blood was taken at the time of primary CDI, but who later became recurrent.

