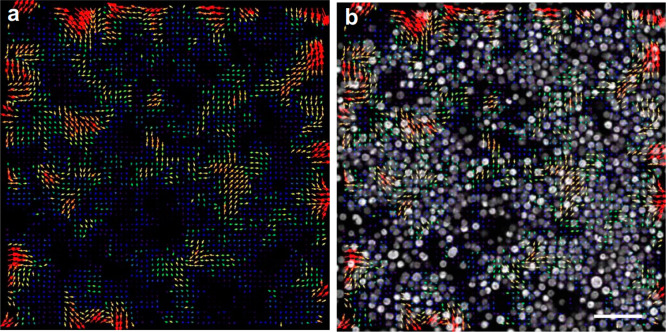
Figure 5.
Particle image velocimetry (PIV) analysis of fluidic coupling in the bacteria–microalgae cocultures. (a) Microalgae concentration field. Arrows exhibit the direction or orientation of the microalgae clusters compared with the previous frame of the image. (b) Overlay of the PIV color-coded vector plot with time-lapse sequence from mixed E. coli and C. reinhardtii coculture (autofluorescence tracked) showing the microalgae displacement field overlaid with concentration field. From one time frame to the next, the directional motion, microalgae cluster splitting, and formation can be compared. Being smaller size and no fluorescent, bacterial cells can be barely seen in (b). Scale bar is 20 μm.

