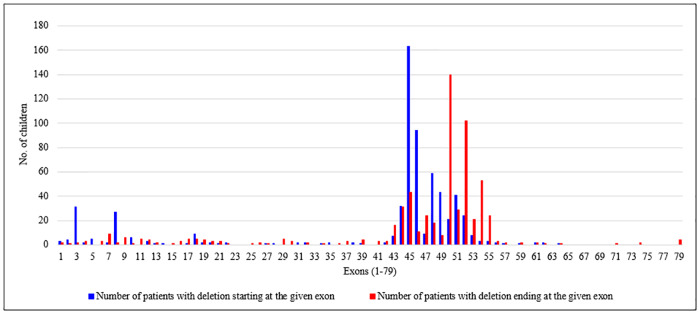
Fig 3. Deletion mutations in the DMD gene in 642 patients mapped to two hotspot regions: Proximal (exons 1–22) and distal (exons 43–55).
The frequency of deletion mutations in the DMD gene has been shown. Blue bars represent patients with deletions beginning in the indicated exon. Red bars represent patients with deletion mutations ending in the indicated exon.

