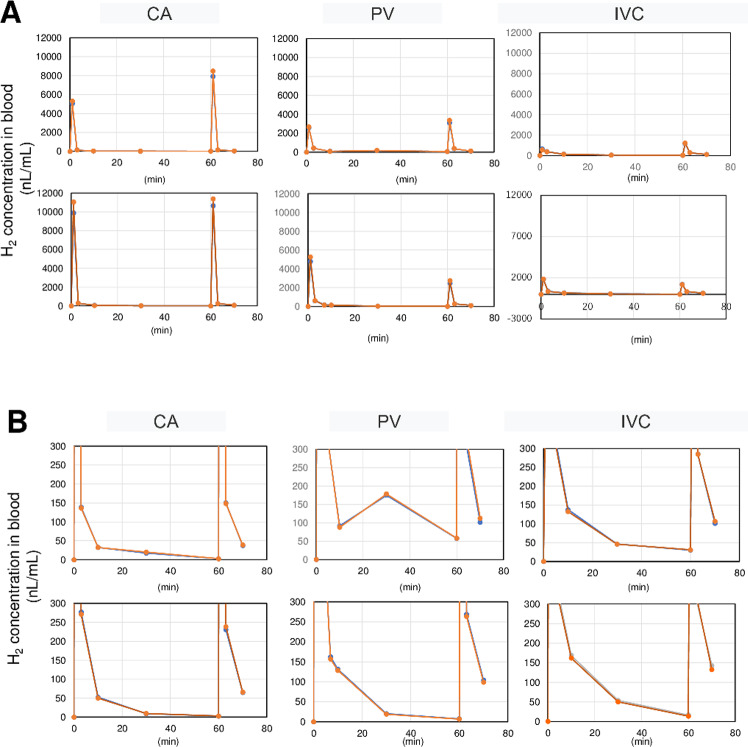
Fig 2. Time course of blood concentration of H2 after a single inhalation.
(A) Peak H2 concentration in the CA reached 28–60% saturation. Peak H2 concentration in venous blood (PV, IVC) was much lower than that in arterial blood (CA>>PV>IVC). (B) Enlarged low-concentration areas from Fig 3A. After 10 min, blood H2 concentrations were highest in the IVC, then the PV, and lowest in the CA. After 60 min, H2 concentration in the PV and IVC remained higher than at steady state. In A and B, upper and lower graphs in each panel show readings from pig 1 and pig 2, respectively. Duplicate H2 concentration measurements are overlaid. CA, carotid artery; PV, portal vein; IVC, supra-hepatic inferior vena cava.

