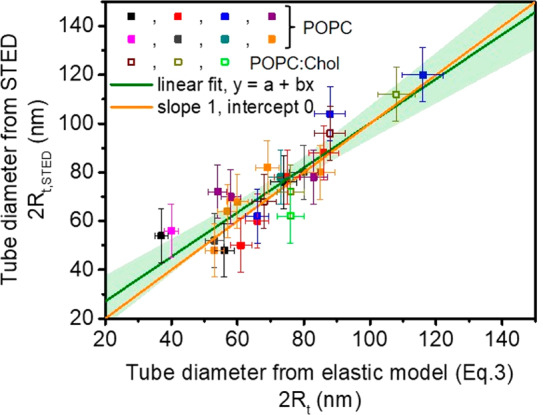
Figure 3.

Plot of membrane nanotube diameters as directly measured using STED (Rt, STED) versus tube diameter estimated using eq 3 (Rt). Different colors correspond to measurements on different vesicles. Solid symbols represent data measured on POPC vesicles and open symbols are data collected on vesicles made of POPC/Chol 9:1 (molar ratio). The green line is a linear fit, y = a + bx, with a = 8.86 nm and b = 0.91, and the light green band represents a 95% confidence interval. The orange line with slope 1 is included for comparison.
