
Fig. 2. Structure of NPC1L1 in complex with ezetimibe-PS.
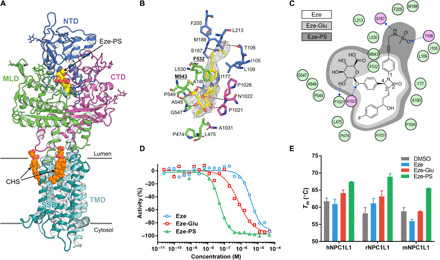
(A) Ribbon representation of the ezetimibe-PS bound NPC1L1 structure viewed from the side of the membrane, colored as in Fig. 1. The ezetimibe-PS (Eze-PS) and two CHS molecules are shown by spheres and colored in yellow and orange, respectively. (B) The binding site of ezetimibe-PS, with surrounding residues within 4 Å in the NTD (blue), MLD (green), and CTD (magenta). EM density is shown as gray mesh, contoured at 5σ. Hydrogen bonds are indicated as dashed lines. (C) Schematic diagram of ezetimibe-PS interactions with surrounding hydrophobic (green) and hydrophilic (pink) residues. Hydrogen bonds are indicated as dashed lines, and the direction of the arrows represents the hydrogen bond donor. The backbone structures of ezetimibe (Eze) and ezetimibe-glucuronide (Eze-Glu) are highlighted in white and light gray areas, respectively. (D) Inhibition of cholesterol uptake by ezetimibe, ezetimibe-glucuronide, and ezetimibe-PS (E) Effect of ezetimibe, ezetimibe-glucuronide, and ezetimibe-PS on the Tm of NPC1L1 proteins. Error bars indicate SE, n = 3.